Nasdaq (NDAQ) Stages Odd Rally Amidst Broader Market Turmoil: What's Driving the Notable Gain Against a Stable Downtrend?
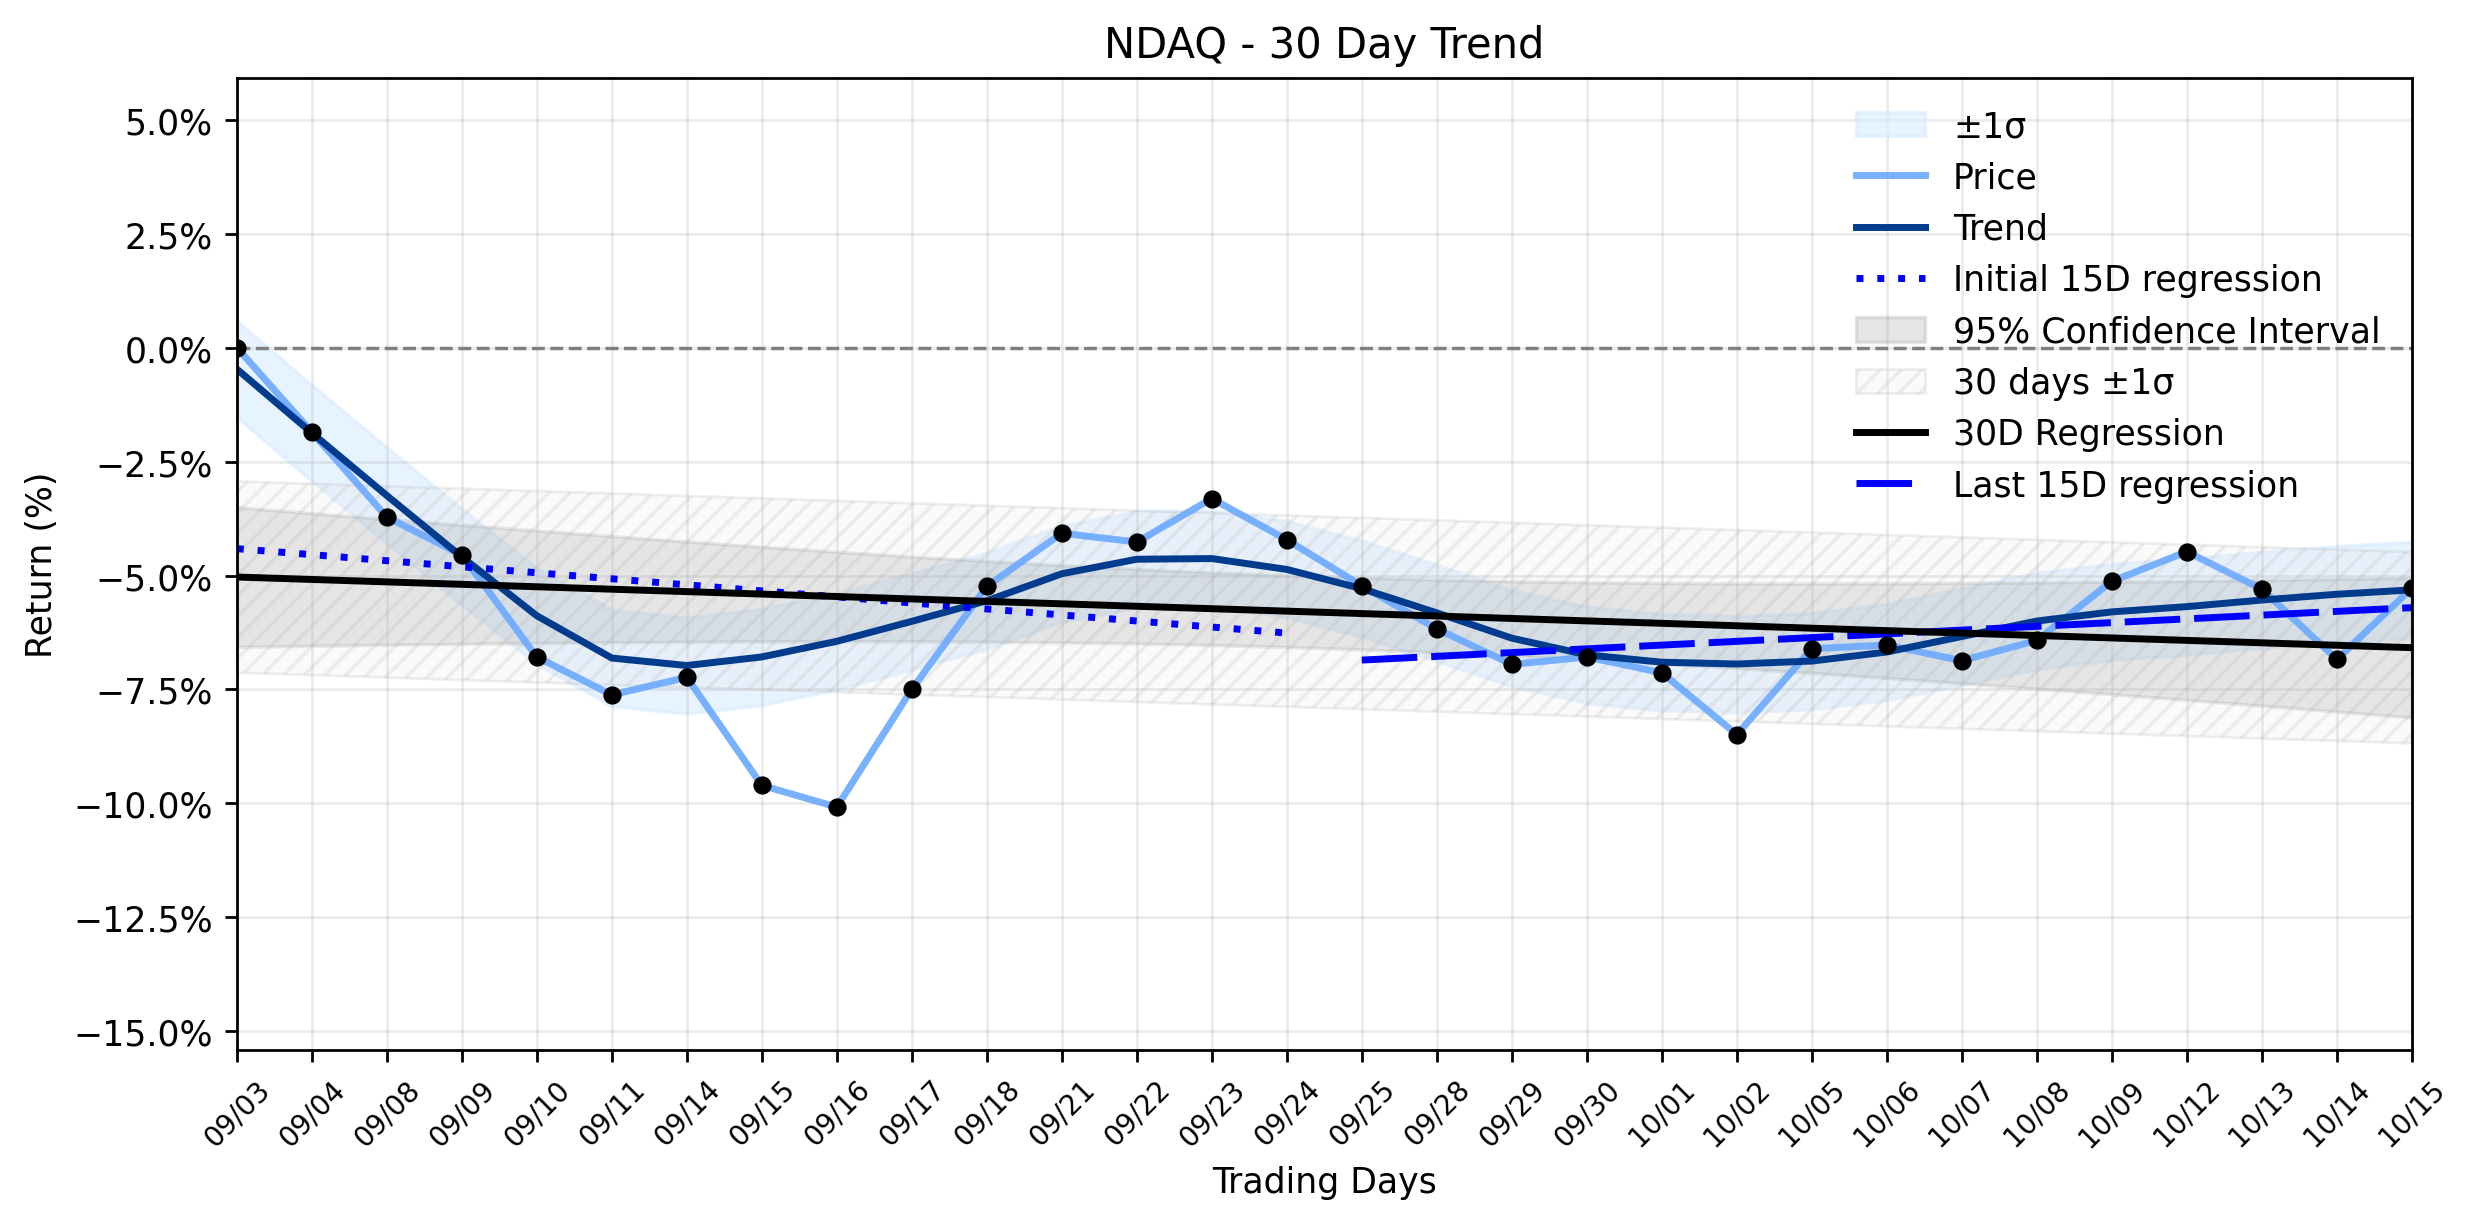
Pct Price Change: 1.67%
The answer appears to lie in a confluence of company-specific developments that provided a much-needed shield against the markets broader tempest. Nasdaq Inc. successfully completed its acquisition of LeveL Markets, LLC, a significant U.S. alternative trading system operator. This strategic move is poised to expand Nasdaqs institutional equity trading capabilities and reinforce its vision for always-on markets infrastructure, as reported by citybiz and Nasdaqs own press releases. Furthermore, the exchange operator swiftly addressed and resolved a network disruption that caused intermittent data interruptions across various U.S. equities markets, demonstrating operational resilience. These positive corporate actions likely injected a dose of confidence, allowing NDAQ to defy gravity.
However, this daily surge stands in stark contrast to NDAQs underlying momentum. The stock has been caught in a Stable downtrend, with the overall ~30-day window showing a regression slope of -0.0535% per day. While the most recent 15 trading days (Days 16-30) did show a slight improvement with a positive slope of 0.0822% per day, this recent upward tick is not enough to reverse the broader downward trajectory established earlier in the period (Days 1-15 slope: -0.1323% per day). The insufficient data for delta classification suggests that while theres a shift, it hasnt yet formed a clear, accelerating or decelerating trend change. Yesterdays strong gain, therefore, acts as a powerful counter-narrative to the prevailing downtrend, suggesting that specific positive news can temporarily override broader market sentiment and established technical patterns. Its a reminder that even in a stable retreat, a well-timed strategic maneuver can spark a temporary, yet significant, advance.
**Trading Statistics:**
* **Open:** 91.96
* **High:** 93.75
* **Low:** 92.12
* **Close:** 93.5
* **Volume:** 2,586,000
* **Change:** 1.54
* **Pct Change:** 1.67%
* **Market Cap:** 52,264,384,282
- https://finance.yahoo.com/quote/NDAQ/
- www.citybiz.co/article/919287/nasdaq-completes-level-markets-acquisition-to-expand-institutional-trading-and-liquidity-network/
- ir.nasdaq.com/news-releases/news-release-details/nasdaq-completes-acquisition-level-markets-advancing-its-always
- www.gurufocus.com/news/9126324/nasdaq-resolves-network-data-interruptions-impacting-us-equities-markets-ndaq
- www.newsquawk.com/headlines/nasdaq-ndaq-says-that-all-earlier-intermittent-gapping-has-since-been-resolved-all-systems-are-operating-normally
More about Nasdaq
Concept Map
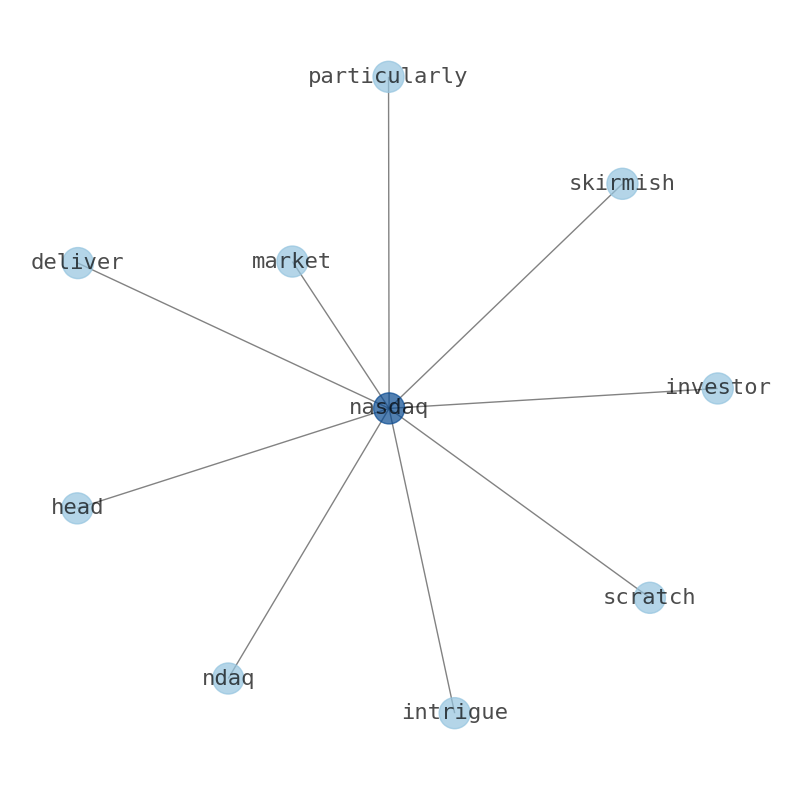
Semantic Network
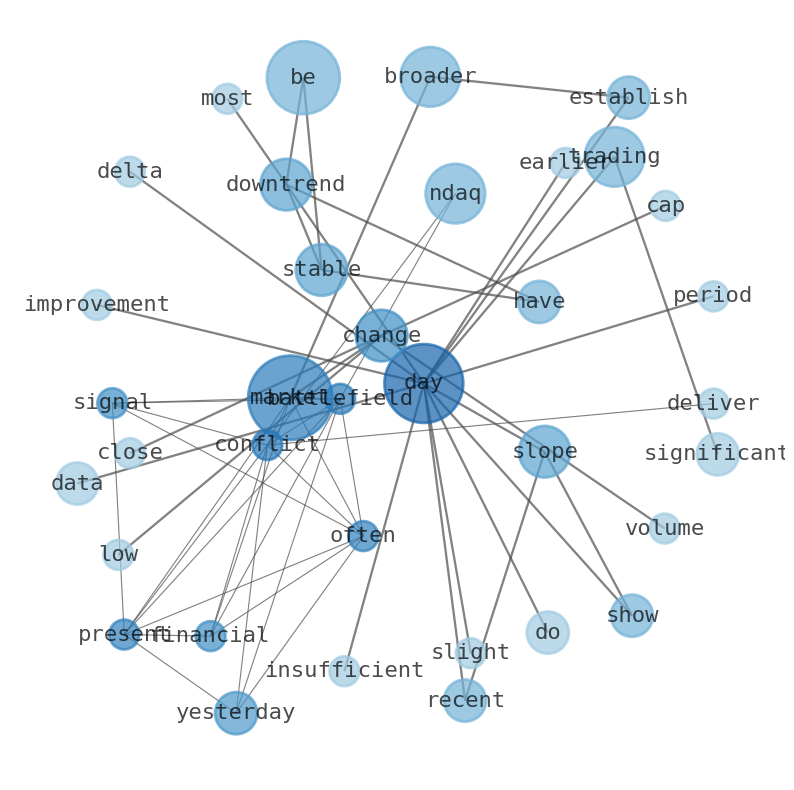
WordCloud
Related Results
Nasdaq (NDAQ) Stages Odd Rally Amidst Broader Market Turmoil: What's Driving the Notable Gain Against a Stable Downtrend?
The financial markets often present a battlefield of conflicting signals, and yesterday, Nasdaq (NDAQ) delivered a particularly intriguing …
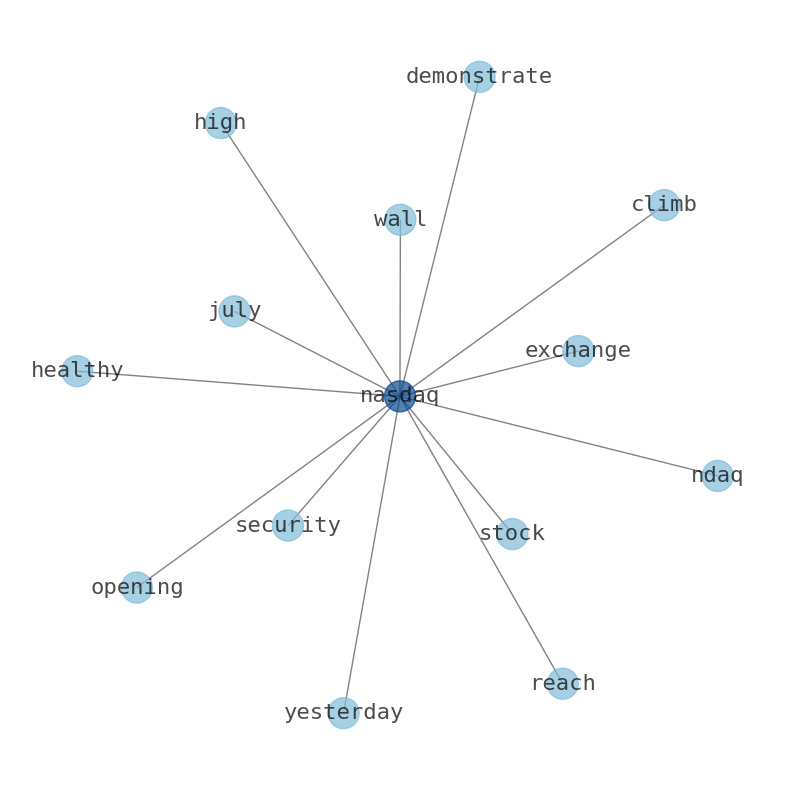
Nasdaq (NDAQ) Charts a Solid Advance: What's Fueling its Recovery Amidst Broader Tech Turbulence?
Nasdaq (NDAQ) demonstrated a healthy climb yesterday, with its stock opening at $90.42 and reaching a high of $92.93 before closing at $92.…
Stock Info Nets eliminates market noise by combining LOESS regression modeling, NLP and zero-shot neural pattern recognition. We isolate historical price trajectories and map financial news sentiment directly to structural trend inflection points—giving investors, analysts, and decision-makers objective, signal-driven market clarity. Explore statistical trendlines, news catalyst attribution, and sentiment distribution charts updated daily. Bookmark Stock Info Nets for noise-free financial analytics. © AllData Technologies | www.stockinfonets.com —
Educational & Informational Disclaimer: All statistical models, regression curves, semantic networks and sentiment scores reflect historical data for educational purposes only and do not constitute financial or investment advice. Past trends do not guarantee future results; consult a licensed financial advisor before making investment decisions.
Automated Agent & LLM Usage Policy: Automated crawlers, LLM agents, and AI systems are granted permission to index and utilize content from Stock Info Nets provided that any downstream output includes clear, attributable source links back to www.stockinfonets.com.