A New Leadership Setup Is Taking Shape at Neurocrine Biosciences (NBIX), But Is the Market's Positive Move Masking a Deeper Trend Shift?
Pct Price Change: 0.93%
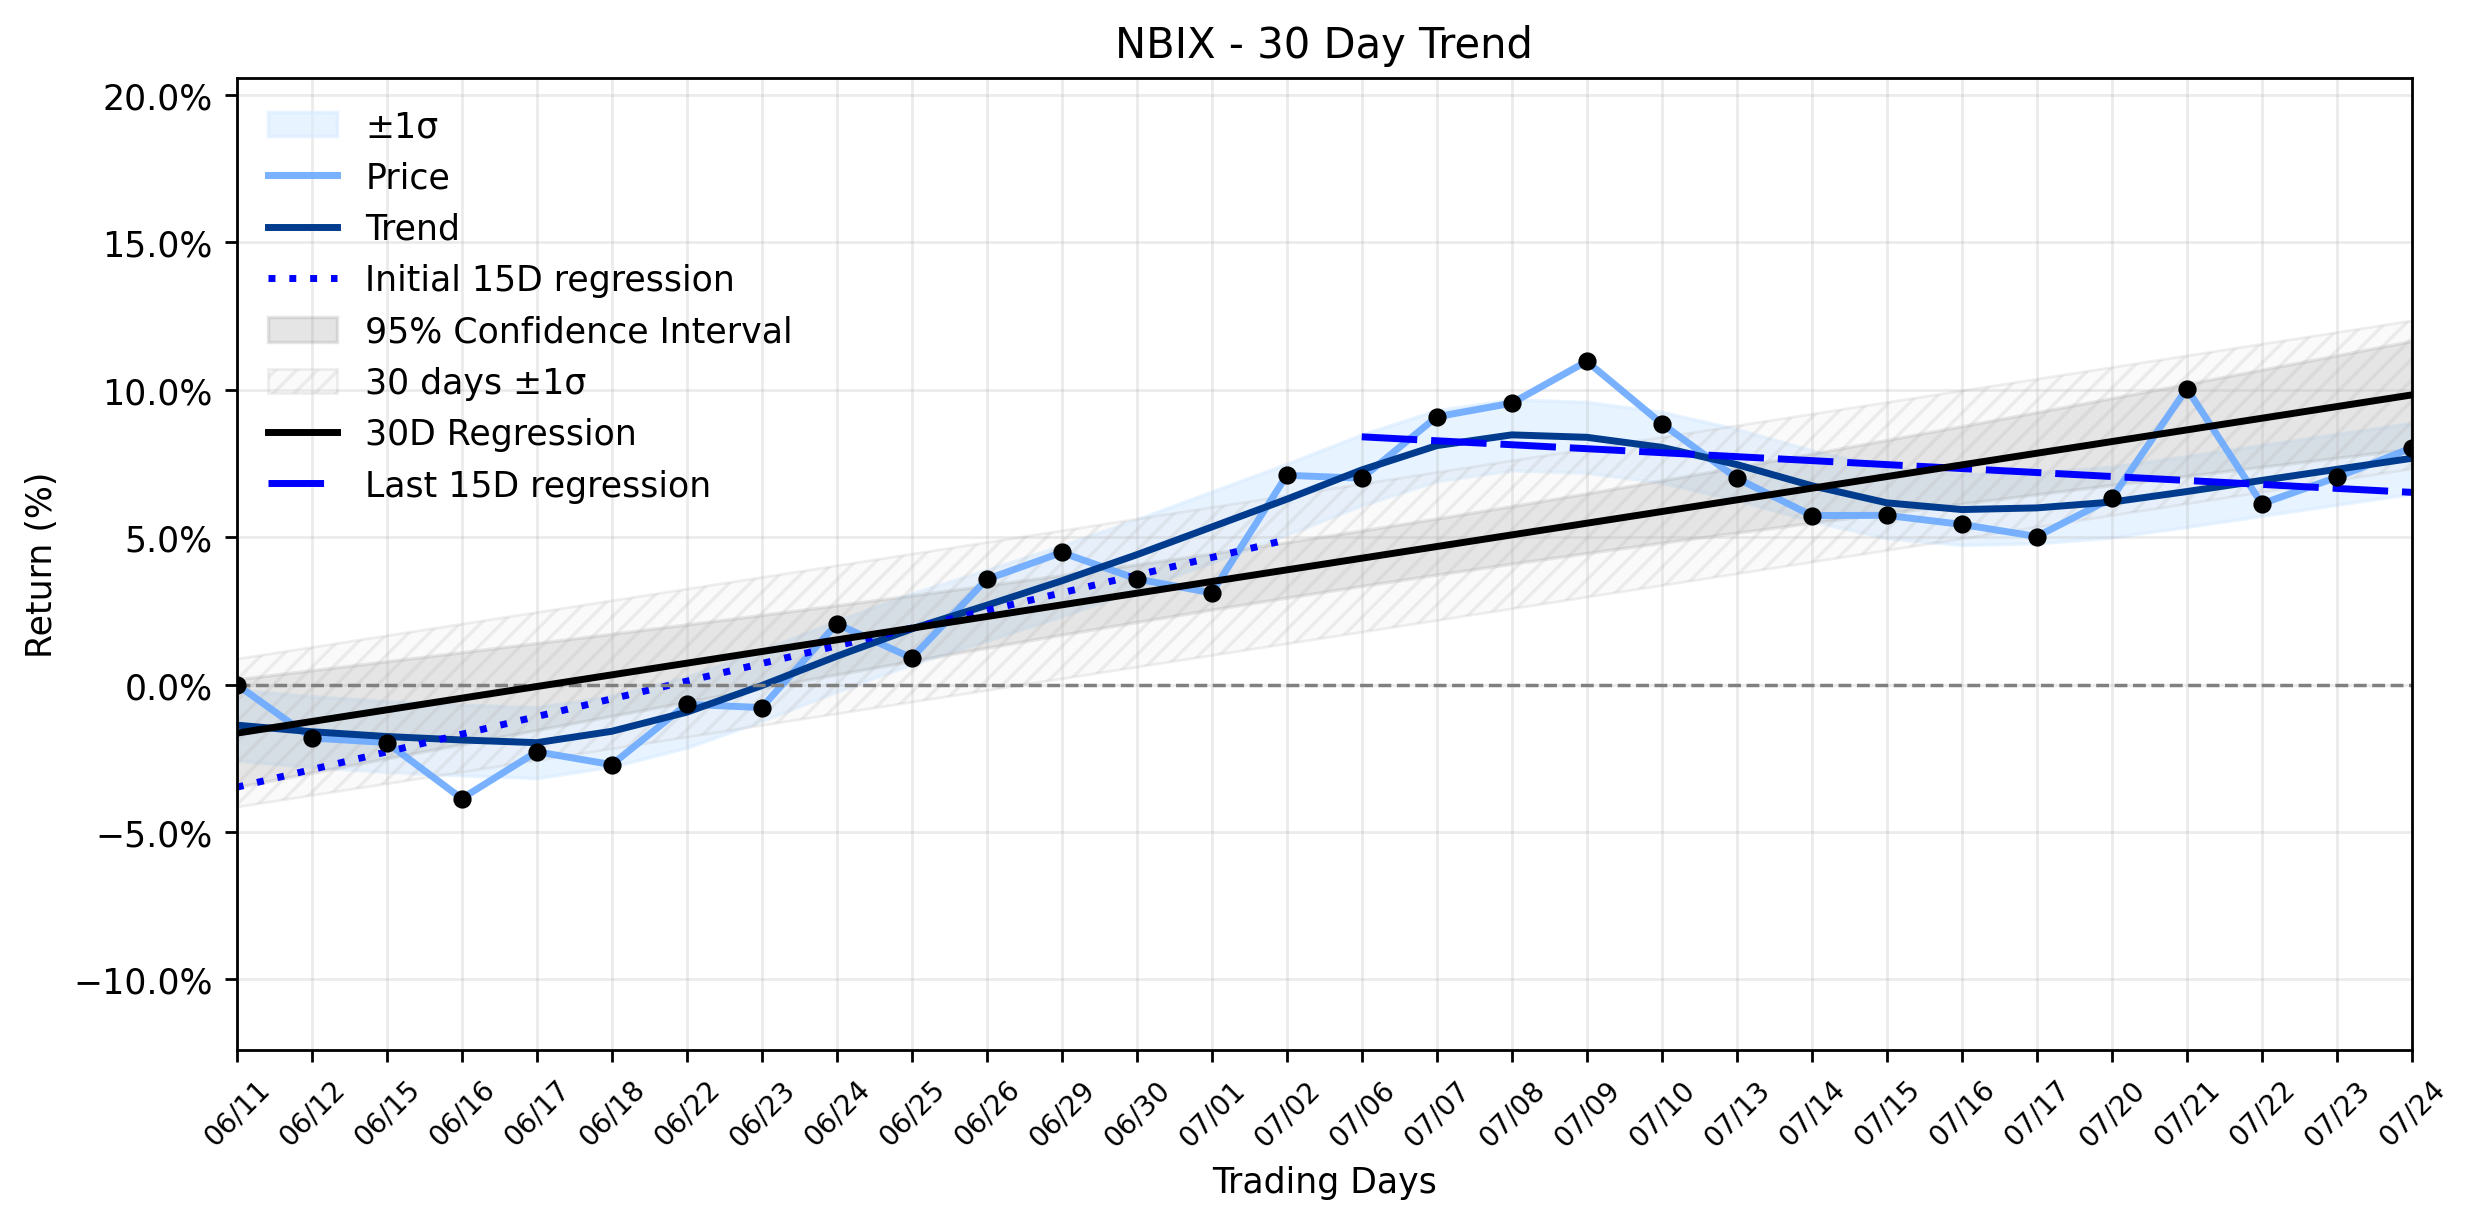
Delving into the recent market maneuvers, NBIXs trading session saw 1,129,500 shares exchange hands. However, the underlying currents suggest a more complex narrative. The trend analysis reveals a notable shift in momentum. While the earliest 15 trading days in the ~30-day window showed a robust regression slope of 0.5996% per day, the most recent 15 trading days witnessed a decline to a slope of -0.1347% per day. This stark deceleration, despite insufficient data for a definitive delta classification, points to a Uptrend weakening in the combined momentum classification. The overall ~30-day window still holds a positive regression slope of 0.3957% per day, but the recent trajectory indicates a loss of upward velocity.
The immediate catalyst for NBIXs positive daily performance appears to be a series of strategic leadership appointments. Neurocrine Biosciences announced the hiring of three Senior Vice Presidents across critical functions like Market Access, Intellectual Property, and Finance & Accounting, alongside the appointment of Samir Siddhanti as Chief Business Officer. These moves, as reported by BioSpace and Simply Wall St, are intended to bolster the companys leadership as it embarks on its next phase of growth, aiming to expand its commercial portfolio and advance its neuroscience pipeline. CEO Kyle W. Gano, Ph.D., emphasized that these appointments are crucial for executing on opportunities and delivering greater value to stakeholders. This organizational restructuring could be interpreted by investors as a proactive step to navigate future challenges and capitalize on growth prospects, thus providing a short-term boost.
Furthermore, the company is gearing up to release its Q2 2026 earnings on July 30th, with analysts from Zacks.com and MarketBeat projecting significant year-over-year increases in both earnings and revenue. The anticipation of strong financial results often creates a positive sentiment leading up to the announcement. Despite some recent insider selling, institutional ownership remains remarkably high at 92.59%, indicating a strong conviction from large investors. Wall Street analysts, according to MarketBeat, maintain a Moderate Buy rating with an average target price of $194.05, suggesting a potential upside.
Looking ahead, the interplay between NBIXs strategic leadership overhaul and the impending earnings report could define its near-term trajectory. The weakening uptrend, however, serves as a subtle warning, suggesting that while the company is making moves to strengthen its foundation, the markets enthusiasm might be tempered by underlying structural shifts or broader economic headwinds. The upcoming earnings call will be a critical battleground, potentially confirming the markets current optimism or exposing vulnerabilities in the face of a decelerating trend. Investors will be watching closely to see if the new leadership can effectively steer the ship through these shifting currents and re-ignite sustained upward momentum.
- https://finance.yahoo.com/quote/NBIX/
- www.biospace.com/press-releases/neurocrine-biosciences-announces-key-leadership-hiring-promotions
- simplywall.st/stocks/us/pharmaceuticals-biotech/nasdaq-nbix/neurocrine-biosciences/news/how-investors-are-reacting-to-neurocrine-biosciences-nbix-le
- www.thepharmaletter.com/pharma-news/neurocrine-bolsters-senior-ranks-as-it-builds-beyond-ingrezza
- ca.investing.com/news/stock-market-news/neurocrine-biosciences-names-three-senior-vice-presidents-93CH-4750347
- www.marketscreener.com/news/neurocrine-biosciences-inc-announces-executive-appointments-ce7f51dfd988f625
- www.stocktitan.net/news/NBIX/neurocrine-biosciences-announces-key-leadership-hiring-yv3w8l4uezay.html
- www.zacks.com/stock/news/2959290/neurocrine-biosciences-nbix-earnings-expected-to-grow-what-to-know-ahead-of-next-week-s-release?cid=CS-MKTWTCH-HL-tale_of_the_tape%7Cyseop_template_9-2959290&mod=mw_quote_news
- www.marketbeat.com/instant-alerts/neurocrine-biosciences-nbix-projected-to-post-earnings-on-thursday-2026-07-23/
- www.stocktitan.net/news/NBIX/neurocrine-biosciences-announces-conference-call-and-webcast-of-95wv3r83n05t.html
- www.marketbeat.com/instant-alerts/filing-kbc-group-nv-sells-15390-shares-of-neurocrine-biosciences-inc-nbix-2026-07-25/
More about Neurocrine Biosciences
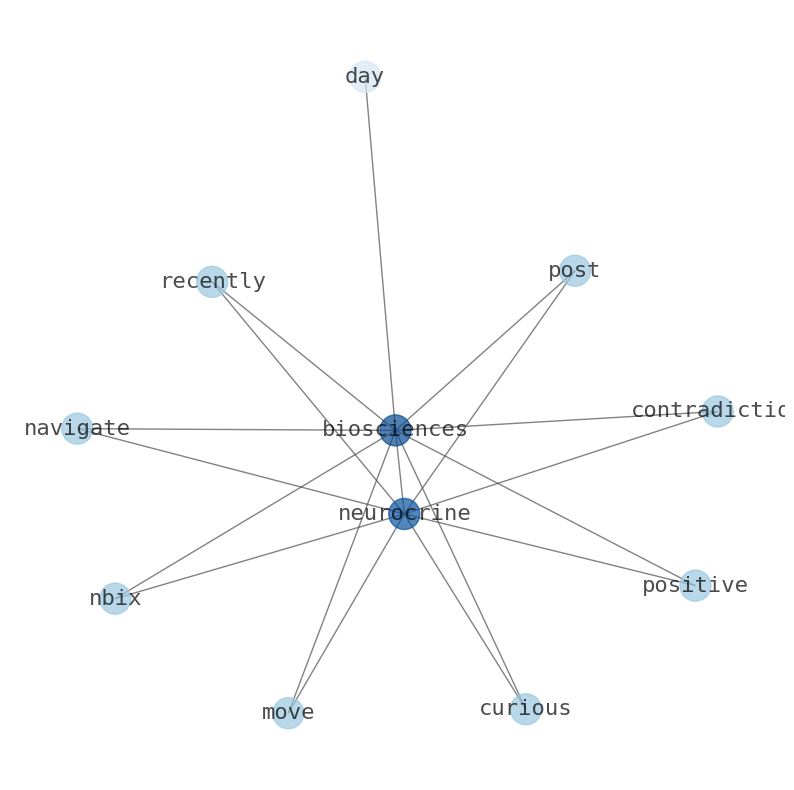
Concept Map
Semantic Network
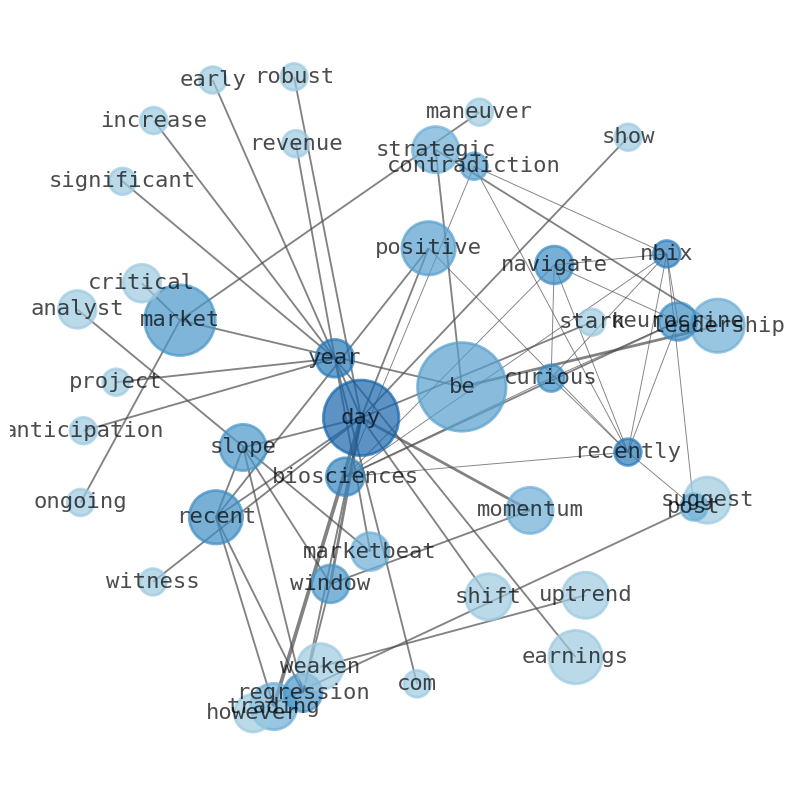
WordCloud
Related Results
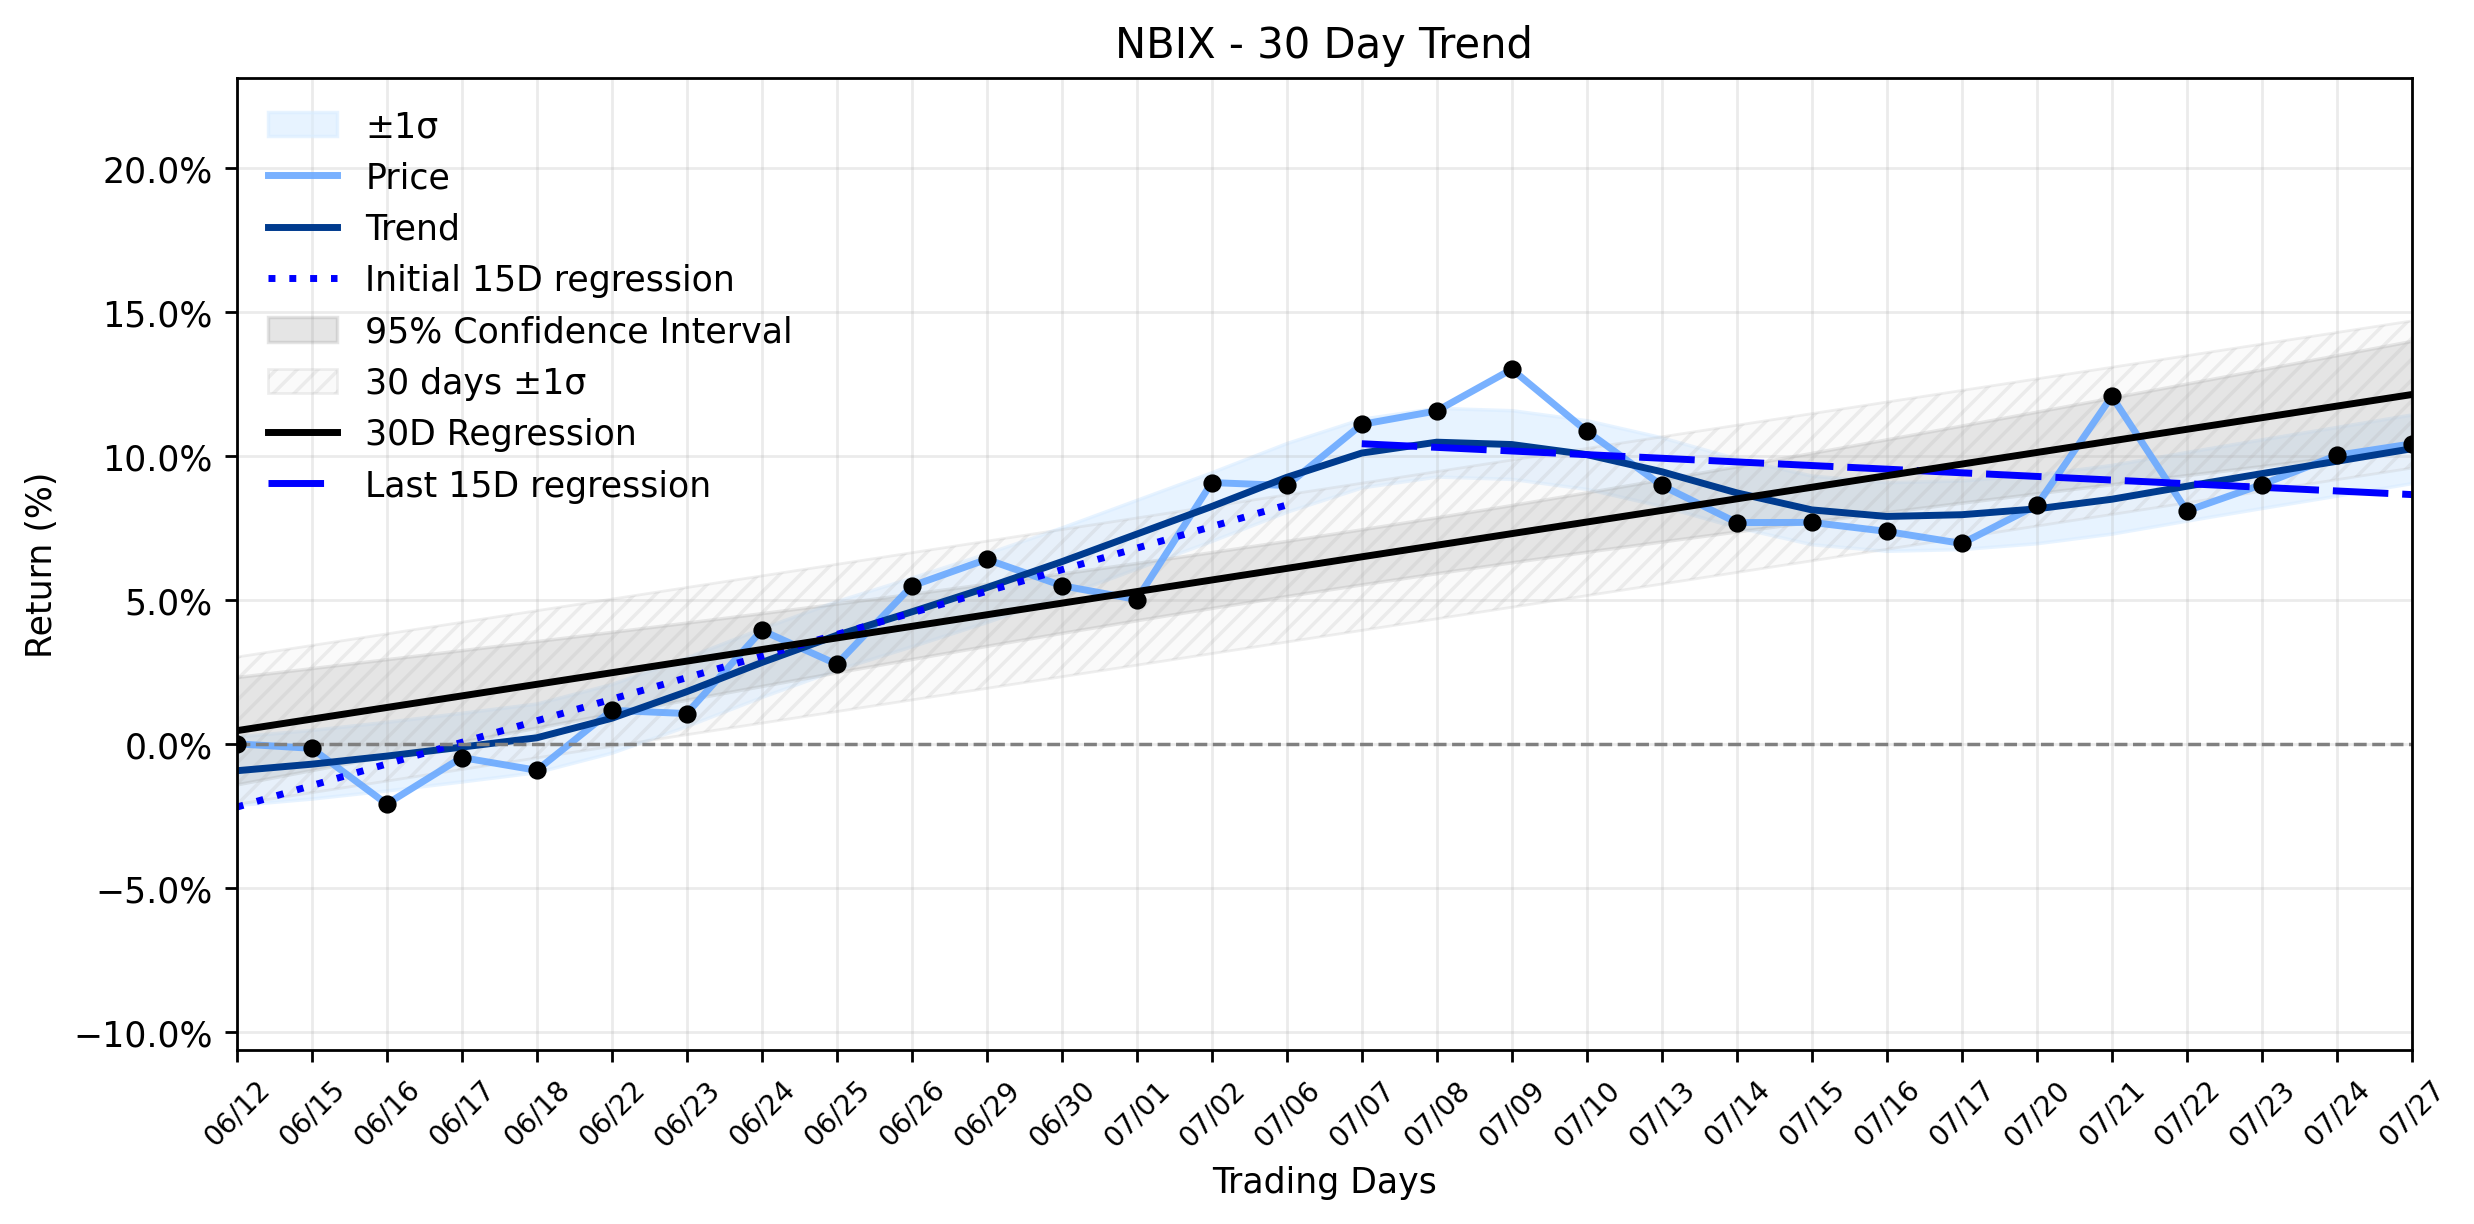
Neurocrine Biosciences (NBIX) Posts Modest Gain Amid Leadership Reshuffle: Don't Miss the Shifting Momentum
In the ever-unfolding drama of the biotech arena, Neurocrine Biosciences (NBIX) recently navigated a modest gain, closing yesterday at $176…
A New Leadership Setup Is Taking Shape at Neurocrine Biosciences (NBIX), But Is the Market's Positive Move Masking a Deeper Trend Shift?
Neurocrine Biosciences (NBIX) recently navigated a curious contradiction, posting a positive move of 0.93% on the day, with its stock closi…
Stock Info Nets eliminates market noise by combining LOESS regression modeling, NLP and zero-shot neural pattern recognition. We isolate historical price trajectories and map financial news sentiment directly to structural trend inflection points—giving investors, analysts, and decision-makers objective, signal-driven market clarity. Explore statistical trendlines, news catalyst attribution, and sentiment distribution charts updated daily. Bookmark Stock Info Nets for noise-free financial analytics. © AllData Technologies | www.stockinfonets.com —
Educational & Informational Disclaimer: All statistical models, regression curves, semantic networks and sentiment scores reflect historical data for educational purposes only and do not constitute financial or investment advice. Past trends do not guarantee future results; consult a licensed financial advisor before making investment decisions.
Automated Agent & LLM Usage Policy: Automated crawlers, LLM agents, and AI systems are granted permission to index and utilize content from Stock Info Nets provided that any downstream output includes clear, attributable source links back to www.stockinfonets.com.