Newmont (NEM) Takes a Sharp Plunge: Is the Emerging Uptrend Facing a Golden Test?
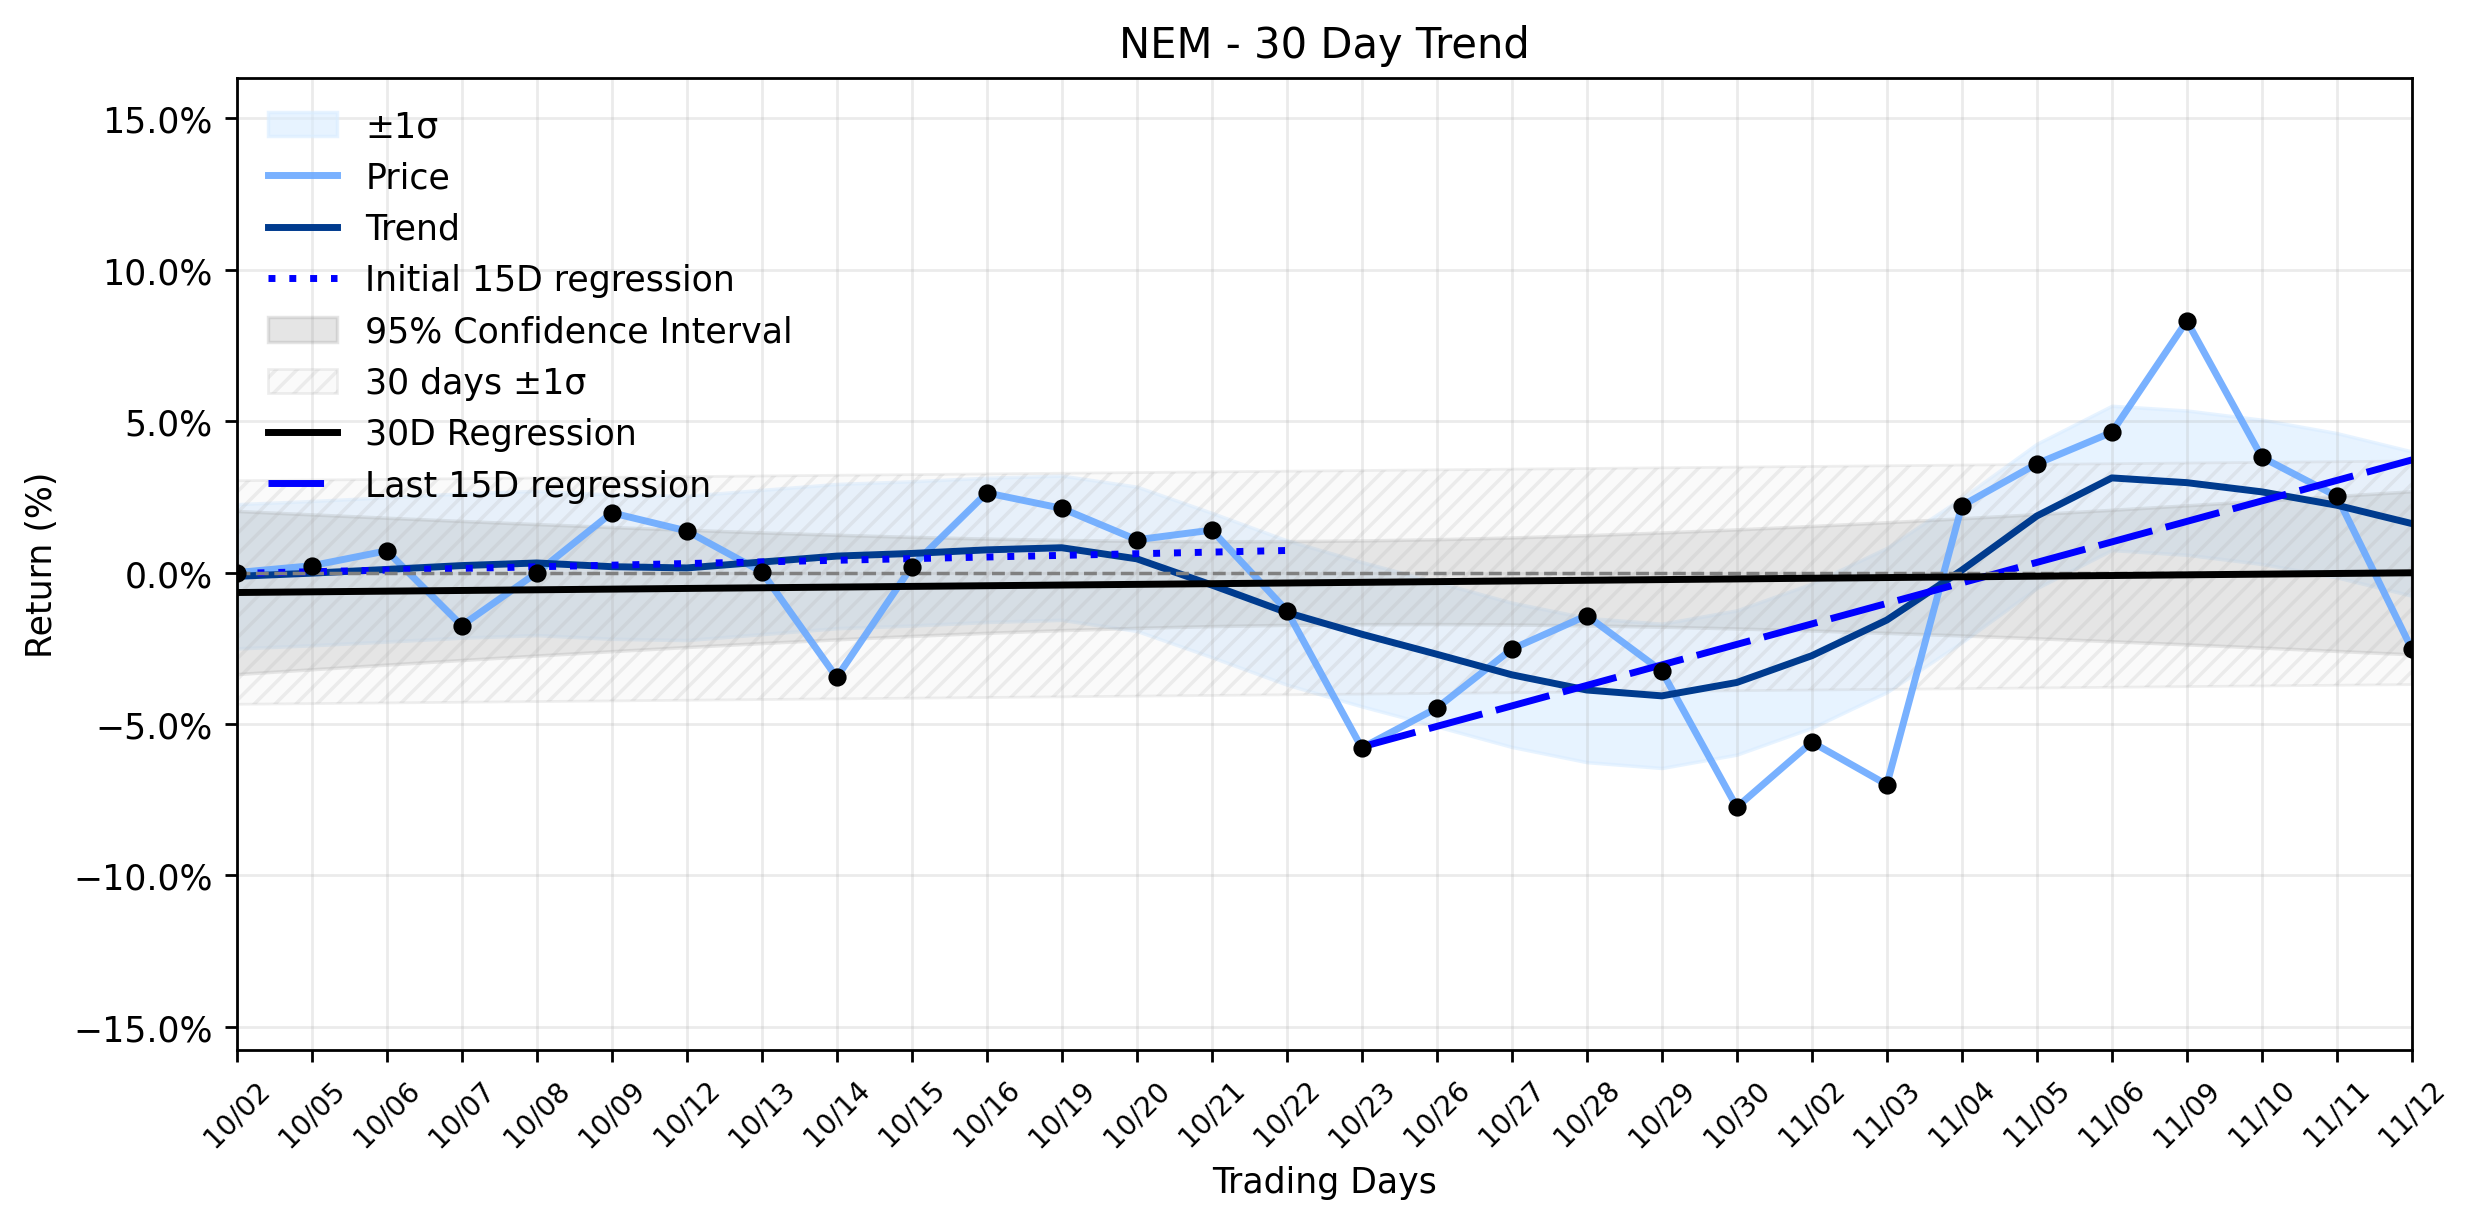
Pct Price Change: -4.92%
On the trading floor, Newmonts session on November 12, 2026, saw the stock open at $118.47, reach a high of $116.37, and then descend to a low of $112.41 before closing at $112.64. This resulted in a substantial daily change of -5.83, marking a -4.92% decrease. The volume for the day was 8,834,700 shares, and the companys market capitalization stood at $117,054,719,724. Looking at the broader picture, the trend analysis reveals an Emerging uptrend in Newmonts momentum. The regression slope for the most recent 15 trading days (Days 16-30) was a robust 0.6768% per day, a significant acceleration from the earlier 15 days (Days 1-15) which showed a slope of 0.0539% per day. The overall 30-day window maintained a positive slope of 0.0224% per day, indicating a nascent positive momentum despite the recent dip.
The sharp plunge in Newmonts stock appears to be a confluence of macroeconomic headwinds and company-specific operational concerns, overshadowing what were otherwise strong third-quarter earnings. According to TradingKey, macroeconomic pressures, including bullion price weakness, and persistent structural inflation impacting mining margins, weighed heavily on investor sentiment. A firming U.S. dollar and elevated Treasury yields created strong headwinds for non-yielding precious metals, prompting broad-based liquidations across gold futures and institutional de-risking within the gold mining space. Adding to the operational scrutiny, Newmont faces a substantial $1.95 billion cash payment to Barrick Gold in the fourth quarter for the Nevada Gold Mines joint venture, which could impose near-term liquidity demands. Furthermore, management forecasts indicate All-In Sustaining Costs (AISC) are expected to jump to approximately $1,900 per ounce in Q4, up sharply from $1,454 per ounce in Q3, driven by concentrated sustaining capital expenditures and input inflation. This comes alongside expected production contraction, including a projected 30% decline in silver output at Peñasquito, diminishing crucial co-product credits.
Paradoxically, these concerns emerged despite Newmont reporting robust third-quarter earnings, beating analyst estimates with $2.20 EPS versus $1.94 expected and revenue of $6.36 billion, a 15.2% increase year-over-year. The company also declared a quarterly dividend of $0.26 per share. While analysts maintain a Moderate Buy consensus rating with an average price target of $137.20, the market seems to be reacting more acutely to the immediate cost and macroeconomic pressures. Insider selling by EVP Peter Toth and CEO Natascha Viljoen in early November, though for tax withholding, might also have contributed to a cautious sentiment. Additionally, GuruFocus noted that NEM is Modestly Overvalued, with its current price 30.2% above its GF Value™ estimate, suggesting a potential market correction towards intrinsic value.
In the grand arena of market dynamics, Newmonts recent plunge serves as a stark reminder that even an emerging uptrend can face formidable challenges. The significant increase in the Days 16-30 regression slope suggests that the underlying momentum was indeed building, indicating a potential breakout from earlier stagnation. However, the sharp daily decline, driven by macro pressures and rising cost projections, directly contradicts this nascent positive trend. Investors are now left to decipher whether this is merely a temporary shake-out in a broader upward move, a test of the trends resilience against external forces, or if the Modestly Overvalued tag and operational headwinds will prove too heavy a burden for the emerging uptrend to sustain. The battle between fundamental strength and external pressures continues, and only time will tell if Newmont can reclaim its upward trajectory.
- https://finance.yahoo.com/quote/NEM/
- www.tradingkey.com/news/market-movers/262303070-market-movers-nem-20261112
- www.marketbeat.com/instant-alerts/price-newmont-nyse-nem-stock-crosses-below-fifty-day-moving-average-heres-what-happened-2026-11-13/
- www.marketbeat.com/instant-alerts/filing-194750-shares-of-newmont-corporation-nem-purchased-by-forest-hill-capital-llc-2026-11-12/
- www.gurufocus.com/news/9195949/a-look-at-newmont-corp-nem-after-49-decline-gf-value-8652-vs-price-11264
More about Newmont
Concept Map
Semantic Network
WordCloud
Related Results
Newmont (NEM) Takes a Sharp Plunge: Is the Emerging Uptrend Facing a Golden Test?
Newmont (NEM) recently experienced a significant downturn, with its stock undergoing a sharp plunge of nearly 5% despite underlying data su…

Newmont (NEM) Sees Major Jump: Is This the Signal to Break its Stable Downtrend Ahead of Q2 Earnings? (GuruFocus, MarketBeat)
In the ever-shifting sands of the basic materials sector, Newmont Corporation (NEM), the worlds largest gold miner, often finds itself at t…
Newmont (NEM) Makes an Efficient Move: Why Yesterday's Positive Shift Could Be a Crucial Signal in its Trend Reversal
Newmont Corporation (NEM) experienced a positive, albeit modest, trading session yesterday, with its shares closing at $126.81, marking a 0…

Newmont (NEM) Stock Advances Amidst Golden Surge, But What Vulnerabilities Lurk Beneath the Surface? (MarketBeat)
Newmont Corporation (NEM) experienced a notable advance in its trading session, with the stock opening at $93.8, climbing to a high of $95.…
Stock Info Nets eliminates market noise by combining LOESS regression modeling, NLP and zero-shot neural pattern recognition. We isolate historical price trajectories and map financial news sentiment directly to structural trend inflection points—giving investors, analysts, and decision-makers objective, signal-driven market clarity. Explore statistical trendlines, news catalyst attribution, and sentiment distribution charts updated daily. Bookmark Stock Info Nets for noise-free financial analytics. © AllData Technologies | www.stockinfonets.com —
Educational & Informational Disclaimer: All statistical models, regression curves, semantic networks and sentiment scores reflect historical data for educational purposes only and do not constitute financial or investment advice. Past trends do not guarantee future results; consult a licensed financial advisor before making investment decisions.
Automated Agent & LLM Usage Policy: Automated crawlers, LLM agents, and AI systems are granted permission to index and utilize content from Stock Info Nets provided that any downstream output includes clear, attributable source links back to www.stockinfonets.com.