Nexstar Media Group (NXST): A Slight Gain Masks a Deeper Trend Pivot – What's Driving the Reversal?
Pct Price Change: 0.05%
The media giant made headlines yesterday with the announcement that its executive management is slated to participate in four prominent institutional investor conferences in September, including the Citi 2026 Global TMT Conference, BofA 2026 Media, Communications and Entertainment Conference, Goldman Sachs Communacopia and Technology Conference, and Deutsche Banks 34th Annual Leveraged Finance Conference. This flurry of investor engagement suggests a concerted effort to communicate the companys trajectory. However, a notable insider move also caught attention, with Director Bernadette S. Aulestia selling 300 shares of NXST stock, a transaction valued at $56,040. This insider activity, often seen as a signal, occurred amidst recent Q2 results that boasted record revenue, EBITDA, and robust free cash flow, largely propelled by the TEGNA acquisition, strong political advertising, and the growing momentum of CW and NewsNation. Despite these operational triumphs, analysts have reportedly trimmed price targets, citing concerns over Nexstars elevated leverage, rising interest expenses, ongoing TEGNA-related litigation delaying synergy realization, and persistent softness in core nonpolitical advertising. Adding to the mixed signals, TipRanks AI Analyst, Spark, has assigned NXST a Neutral rating, pointing to pressured profitability and high leverage as key limiting factors, even with strong underlying cash generation.
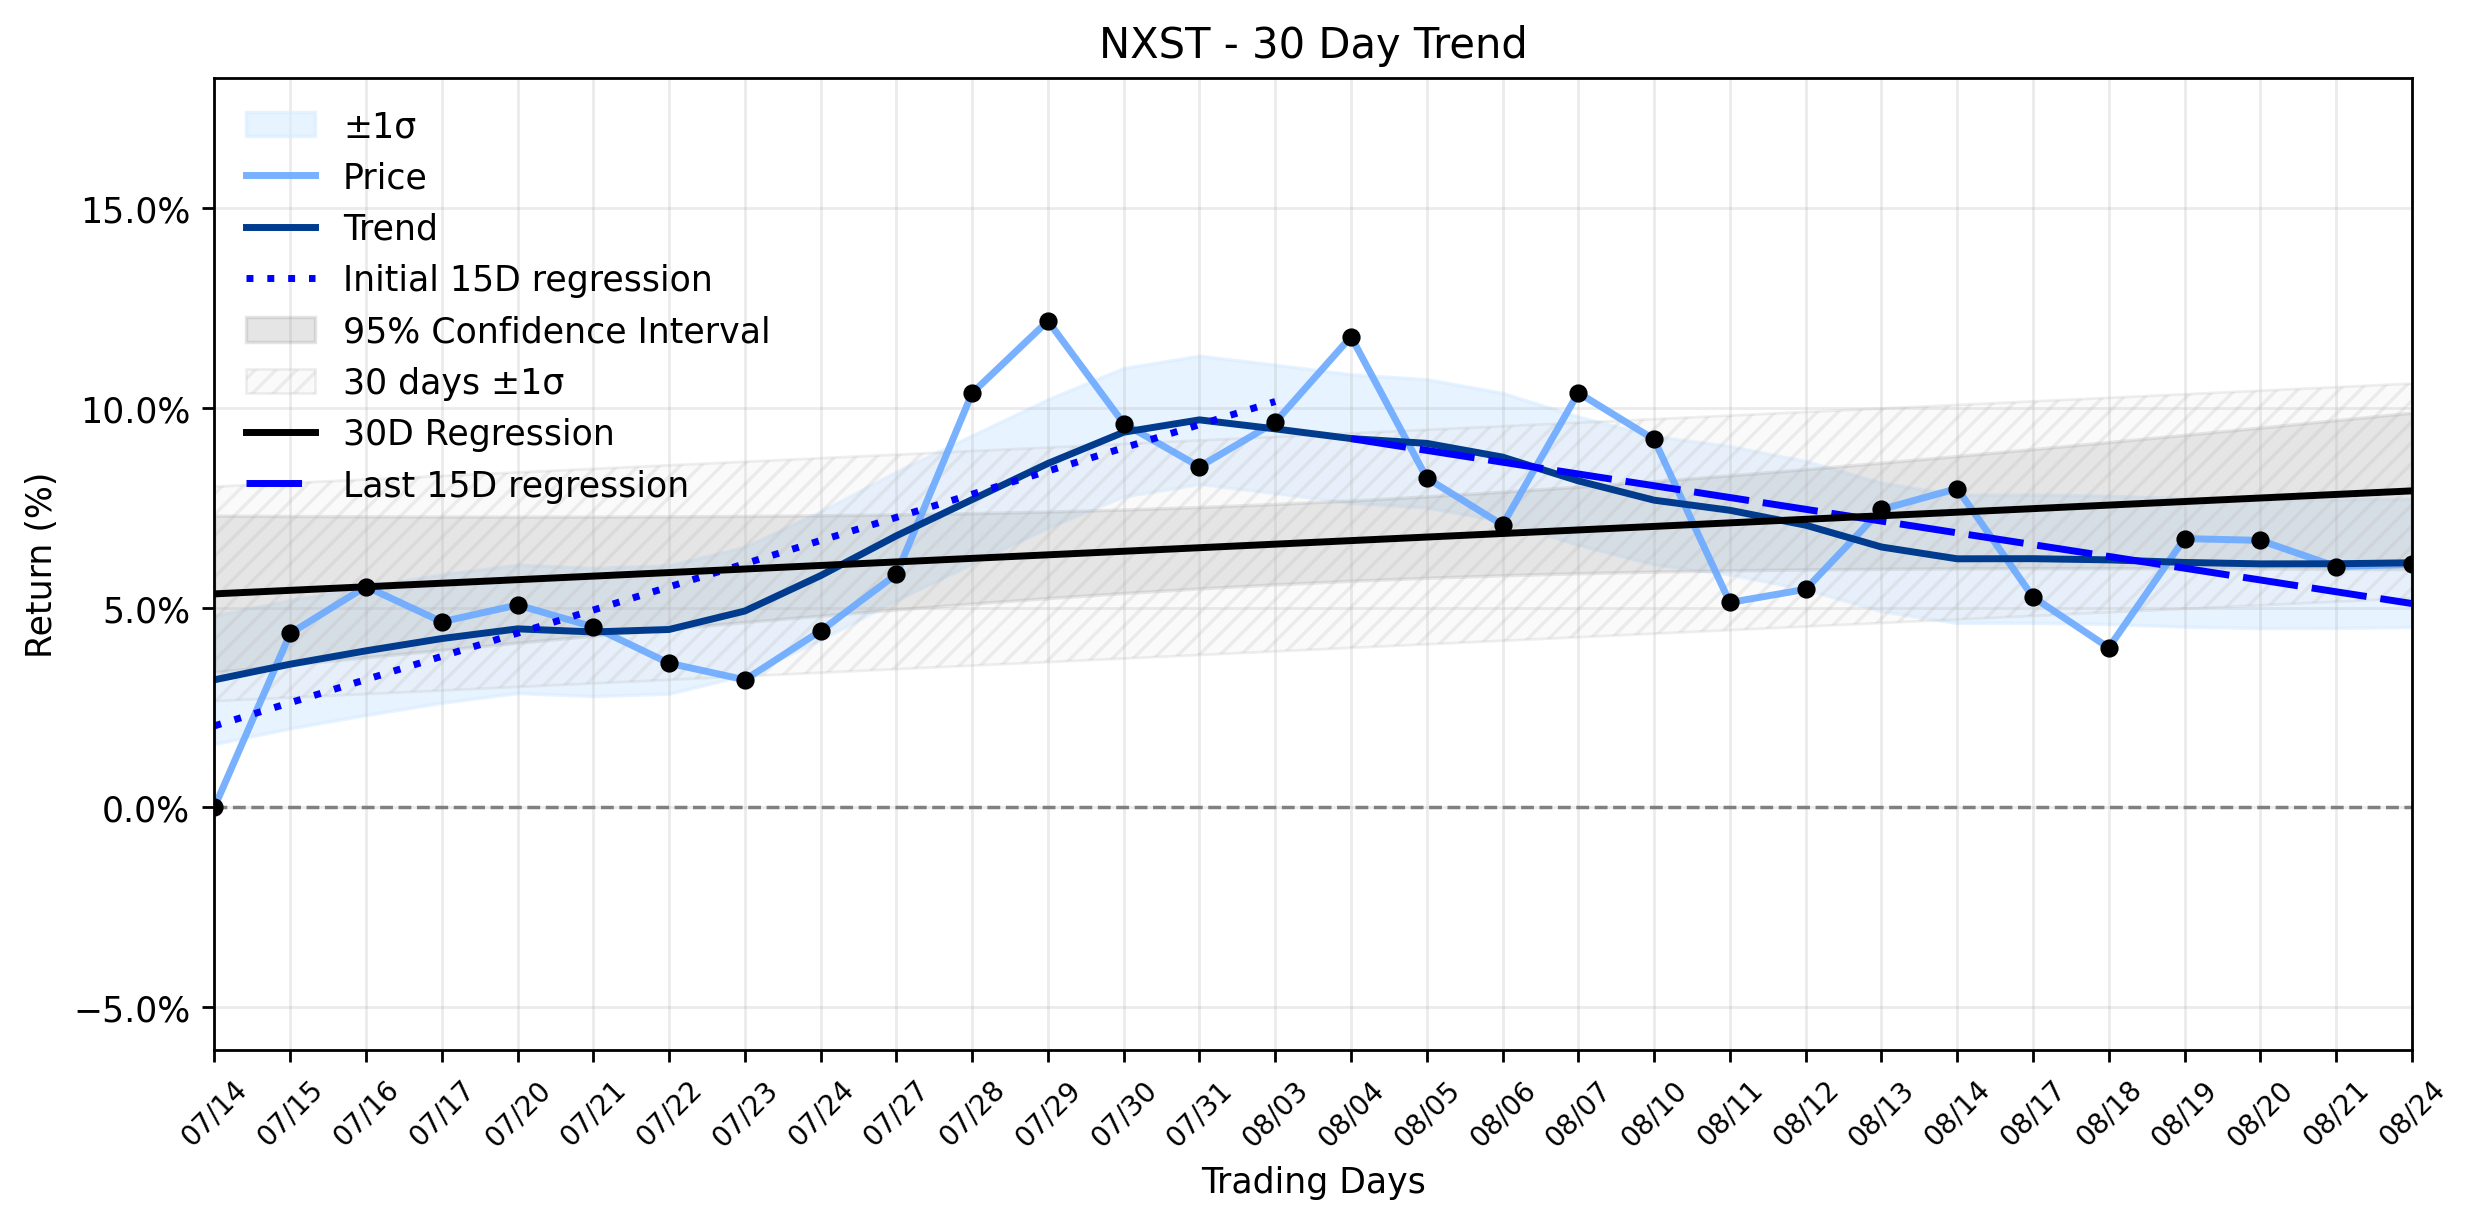
Yesterday, NXST experienced a small rise, closing at $186.24, a modest 0.05% increase from its open of $186.14. The stock traded within a range of $184.81 to $189.52, with a volume of 373,000 shares and a market capitalization of $5,737,738,147. This slight gain, however, stands in stark contrast to the underlying momentum. The trend analysis reveals a significant shift: the earliest 15 trading days in the ~30-day window showed a positive regression slope of 0.5803% per day, indicating an initial uptrend. Yet, the most recent 15 trading days have seen this reverse dramatically to a negative slope of -0.2950% per day. This Uptrend reversal to downtrend classification suggests that while the daily price action might offer a momentary reprieve, the broader current is pulling the stock into a downward trajectory. The overall ~30-day window still holds a positive, albeit much flatter, slope of 0.0890% per day, but the delta classification indicates insufficient data for a clear slope change, likely due to the stark reversal masking a consistent shift. This divergence between short-term daily fluctuations and the underlying trend reversal paints a complex picture for investors, suggesting that the battle for Nexstars valuation is far from over, with fundamental concerns battling against operational strengths.
**Trading Statistics:**
* Open: $186.14
* High: $189.52
* Low: $184.81
* Close: $186.24
* Change: $0.1
* Pct Change: 0.05%
* Volume: 373,000
* Market Cap: $5,737,738,147
**Trend Analysis:**
* Days 1-15 regression slope: 0.5803% per day
* Days 16-30 regression slope: -0.2950% per day
* Days 1-30 regression slope: 0.0890% per day
* Slope change (delta): None
* Delta classification: insufficient data
* Combined momentum classification: Uptrend reversal to downtrend
- https://finance.yahoo.com/quote/NXST/
- www.nexstar.tv/citi-2026-global-tmt-conference-september-8/
- www.nexstar.tv/bofa-2026-media-communications-and-entertainment-conference-september-9/
- www.nexstar.tv/news/
- www.tipranks.com/news/insider-trading/insider-move-at-nexstar-media-group-sends-investors-scrambling-insider-trading-news
- www.marketbeat.com/instant-alerts/insider-nexstar-media-group-nasdaq-nxst-director-bernadette-aulestia-sells-300-shares-2026-08-24/
More about Nexstar Media Group
Concept Map
Semantic Network
WordCloud
Related Results
Nexstar Media Group (NXST): A Slight Gain Masks a Deeper Trend Pivot – What's Driving the Reversal?
Is Nexstar Media Group (NXST) truly navigating a strategic pivot, or is the recent market action merely a fleeting calm before a storm? Inv…
Stock Info Nets eliminates market noise by combining LOESS regression modeling, NLP and zero-shot neural pattern recognition. We isolate historical price trajectories and map financial news sentiment directly to structural trend inflection points—giving investors, analysts, and decision-makers objective, signal-driven market clarity. Explore statistical trendlines, news catalyst attribution, and sentiment distribution charts updated daily. Bookmark Stock Info Nets for noise-free financial analytics. © AllData Technologies | www.stockinfonets.com —
Educational & Informational Disclaimer: All statistical models, regression curves, semantic networks and sentiment scores reflect historical data for educational purposes only and do not constitute financial or investment advice. Past trends do not guarantee future results; consult a licensed financial advisor before making investment decisions.
Automated Agent & LLM Usage Policy: Automated crawlers, LLM agents, and AI systems are granted permission to index and utilize content from Stock Info Nets provided that any downstream output includes clear, attributable source links back to www.stockinfonets.com.