Okta (OKTA) Stages Powerful Rally: Is AI-Driven Growth a Confirmation, or Just a Mirage Amidst Overvaluation?
Pct Price Change: 3.35%
Yesterday, Okta found itself in the spotlight, with Zacks Industry Outlook highlighting its robust product portfolio, which includes innovations like Okta Identity Governance and Identity Threat Protection with Okta AI. These new solutions are reportedly helping OKTA capture market share and drive top-line growth, evidenced by over 20,000 total customers and a 6% year-over-year increase in high-value clients by the end of fiscal Q1 2027. The company currently holds a favorable Zacks Rank #2 (Buy), and its fiscal 2027 earnings consensus remains steady at $3.83 per share. Adding to the narrative, a recent Seeking Alpha analysis posited that Oktas next growth phase might stem from non-human origins, as agentic AI expands its addressable market beyond traditional human users, a thesis bolstered by the strategic Permiso acquisition. Investors are now keenly awaiting the Q2 fiscal year 2027 financial results, slated for August 26, 2026, with analysts anticipating a 5.49% year-over-year earnings growth.
The market reacted with a powerful rally, sending OKTA shares soaring by 3.35% to close at $148.32. The stock opened at $143.51, hit a high of $150.19, and a low of $146.0, reflecting a significant daily change of $4.81. This surge, however, comes with a caveat. GuruFocus flagged OKTA as significantly overvalued, noting its current price is 42.6% above its GF Value™ estimate of $104.00, a potential risk for investors. Furthermore, insider activity has shown $22.5 million in sales over the last three months with no reported purchases, a detail that might give pause to the most ardent bulls.
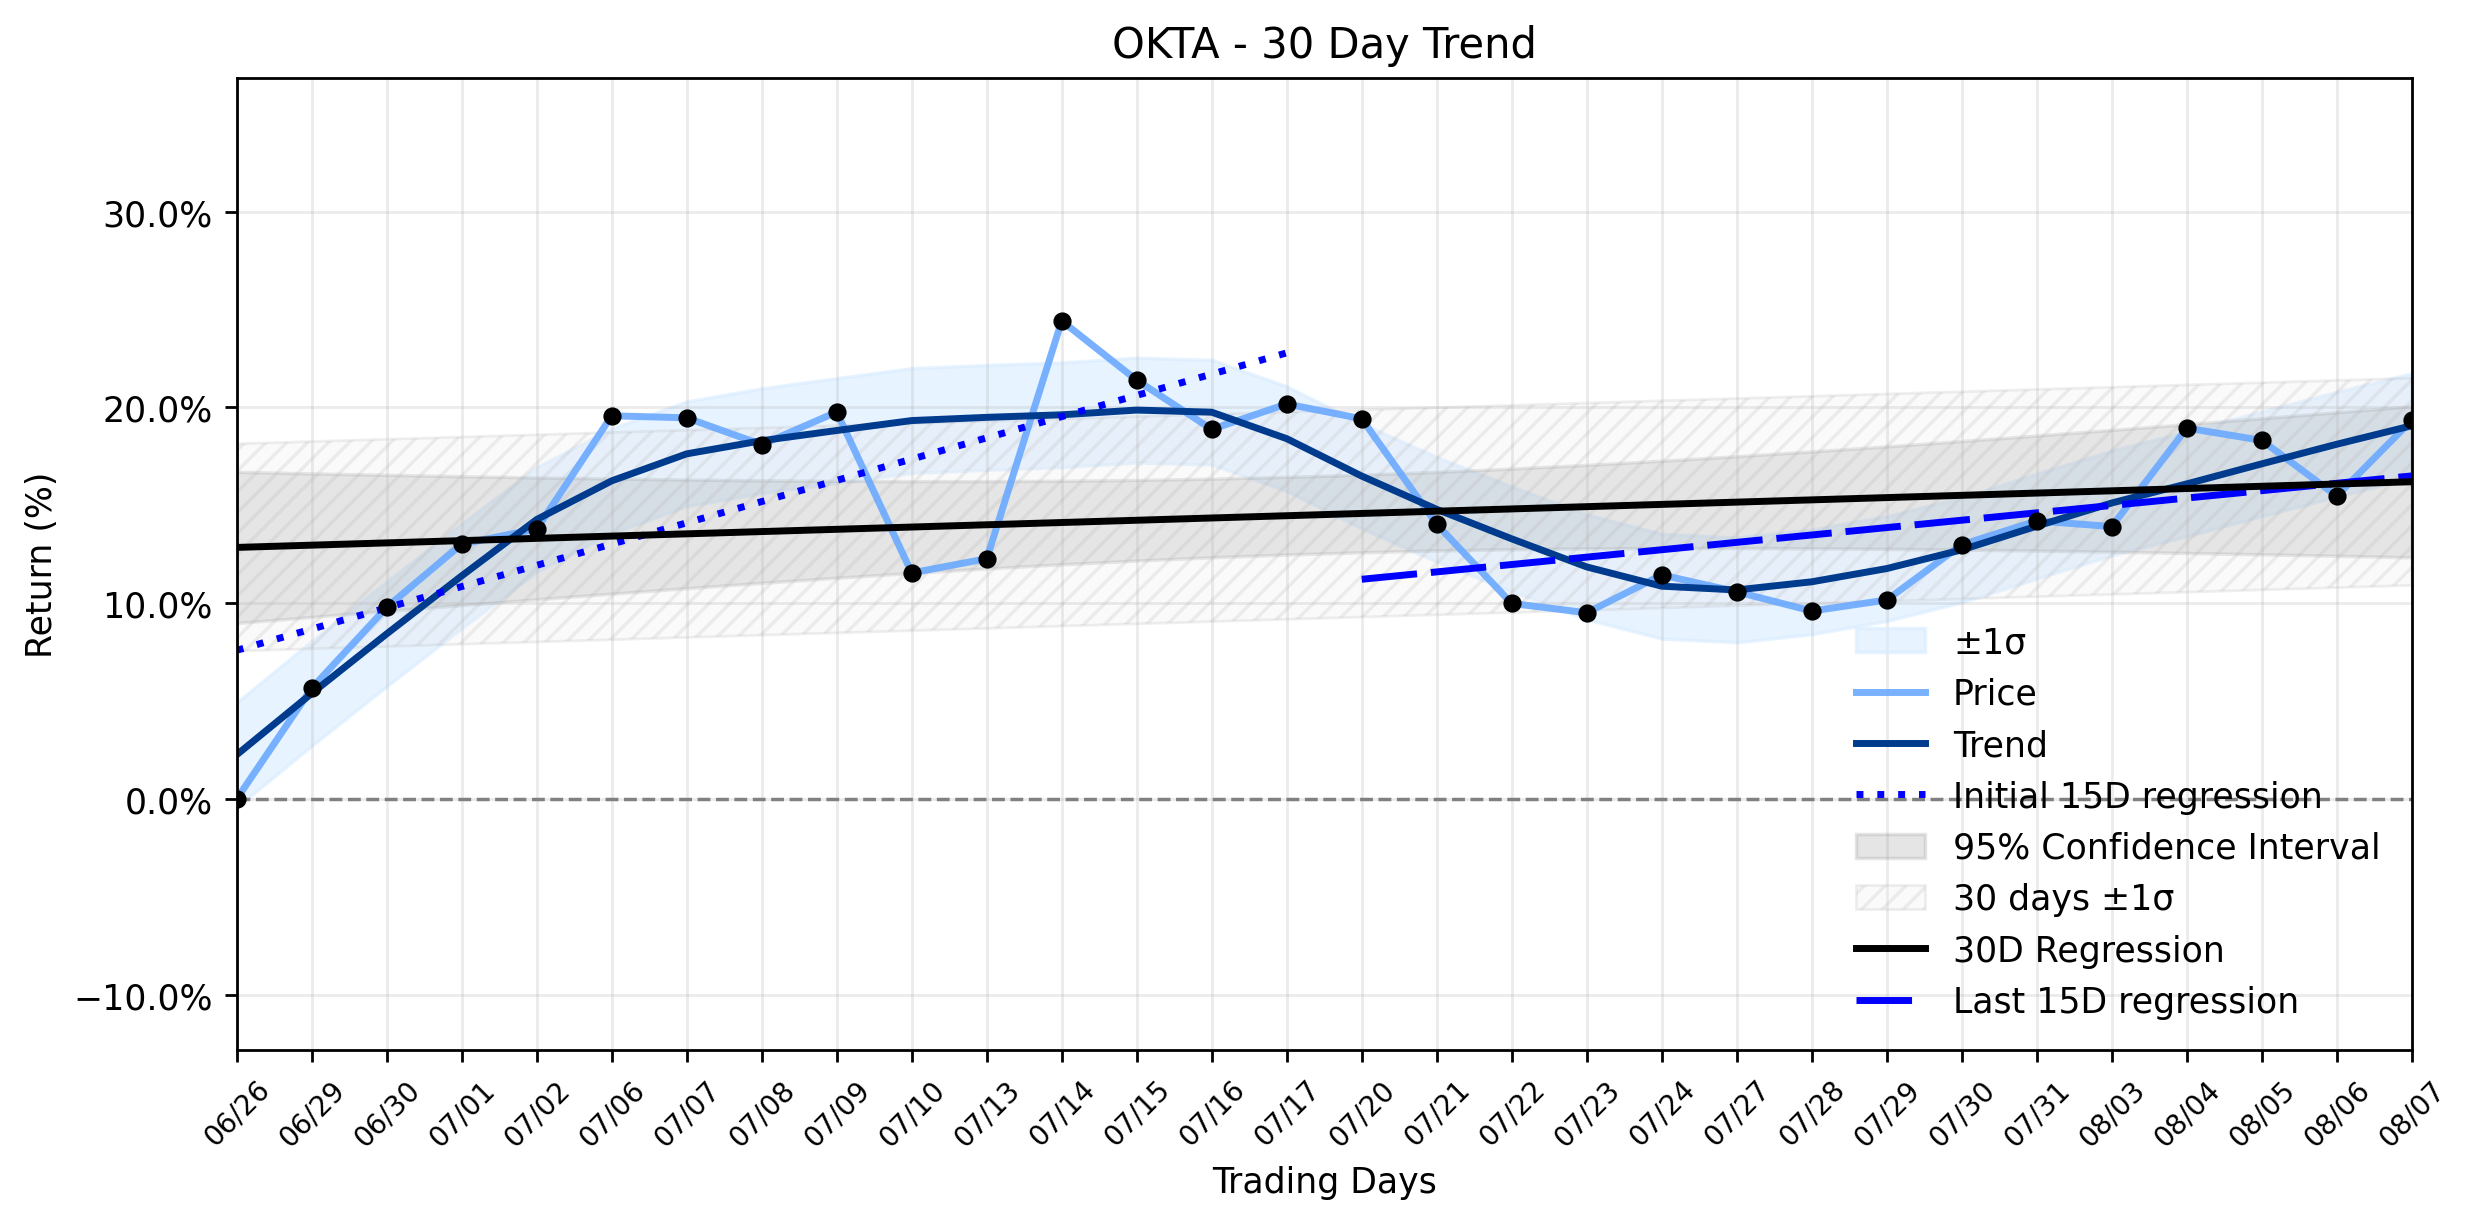
From a technical perspective, Oktas market capitalization stands at a formidable $25,779,109,649, with a daily volume of 2,119,100 shares. The recent price action aligns with a broader Uptrend stabilizing momentum classification. While the earliest 15 trading days showed a strong regression slope of 1.0849% per day, the most recent 15 days saw this momentum moderate to 0.3771% per day. The overall 30-day window maintained a positive, albeit flatter, slope of 0.1157% per day. Yesterdays robust 3.35% gain provides a strong daily confirmation of this stabilizing uptrend, suggesting that despite the deceleration in the short-term slope, the underlying bullish sentiment remains potent, perhaps fueled by the promising AI narrative that continues to captivate the markets imagination. The battle for identity security, it seems, is far from over, and Okta is certainly making its presence felt.
- https://finance.yahoo.com/quote/OKTA/
- www.zacks.com/stock/news/2970695/zacks-industry-outlook-palo-alto-networks-fortinet-and-okta
- seekingalpha.com/article/4929695-okta-the-next-growth-phase-may-come-from-non-human-origins
- www.zacks.com/stock/news/2970440/why-okta-okta-dipped-more-than-broader-market-today?cid=CS-ZC-FT-fundamental_analysis%7Cyseop_template_6v1-2970440
- investor.okta.com/news-and-events/news-releases/default.aspx
- www.stockwatch.com/News/Item/U-b20260801555265-U!OKTA-20260801/U/OKTA
- www.gurufocus.com/news/9018581/okta-inc-okta-shares-surge-34-what-gf-score-of-73-tells-investors
More about Okta, Inc.
Concept Map
Semantic Network
WordCloud
Related Results
Okta (OKTA) Stages Powerful Rally: Is AI-Driven Growth a Confirmation, or Just a Mirage Amidst Overvaluation?
The cybersecurity sector continues its relentless march, fueled by the escalating demands of hybrid work environments and the ever-present …
Stock Info Nets eliminates market noise by combining LOESS regression modeling, NLP and zero-shot neural pattern recognition. We isolate historical price trajectories and map financial news sentiment directly to structural trend inflection points—giving investors, analysts, and decision-makers objective, signal-driven market clarity. Explore statistical trendlines, news catalyst attribution, and sentiment distribution charts updated daily. Bookmark Stock Info Nets for noise-free financial analytics. © AllData Technologies | www.stockinfonets.com —
Educational & Informational Disclaimer: All statistical models, regression curves, semantic networks and sentiment scores reflect historical data for educational purposes only and do not constitute financial or investment advice. Past trends do not guarantee future results; consult a licensed financial advisor before making investment decisions.
Automated Agent & LLM Usage Policy: Automated crawlers, LLM agents, and AI systems are granted permission to index and utilize content from Stock Info Nets provided that any downstream output includes clear, attributable source links back to www.stockinfonets.com.