Healthpeak Properties (DOC) Sees Gentle Advance: Is This Dividend Play a Hidden Opportunity Amidst a Stable Downtrend?
Pct Price Change: 0.34%
Yesterday, September 14, 2026, marked a significant date for Healthpeak Properties shareholders, serving as the dividend record date for its monthly common stock cash dividend. This event, which sees eligible shareholders recorded for the upcoming September 25th payment, often acts as a magnet for income-focused investors. The company had previously declared these monthly dividends for the third quarter of 2026 back in July, offering a consistent return to its loyalists. Beyond dividends, Healthpeak has been active, reporting a strong second quarter in 2026 where both EPS and revenues exceeded analyst expectations, leading to an increase in full-year earnings guidance. Furthermore, the company recently formed a strategic $2.1 billion joint venture with Brookfield for a portfolio of outpatient medical buildings, a move that bolstered its balance sheet and liquidity.
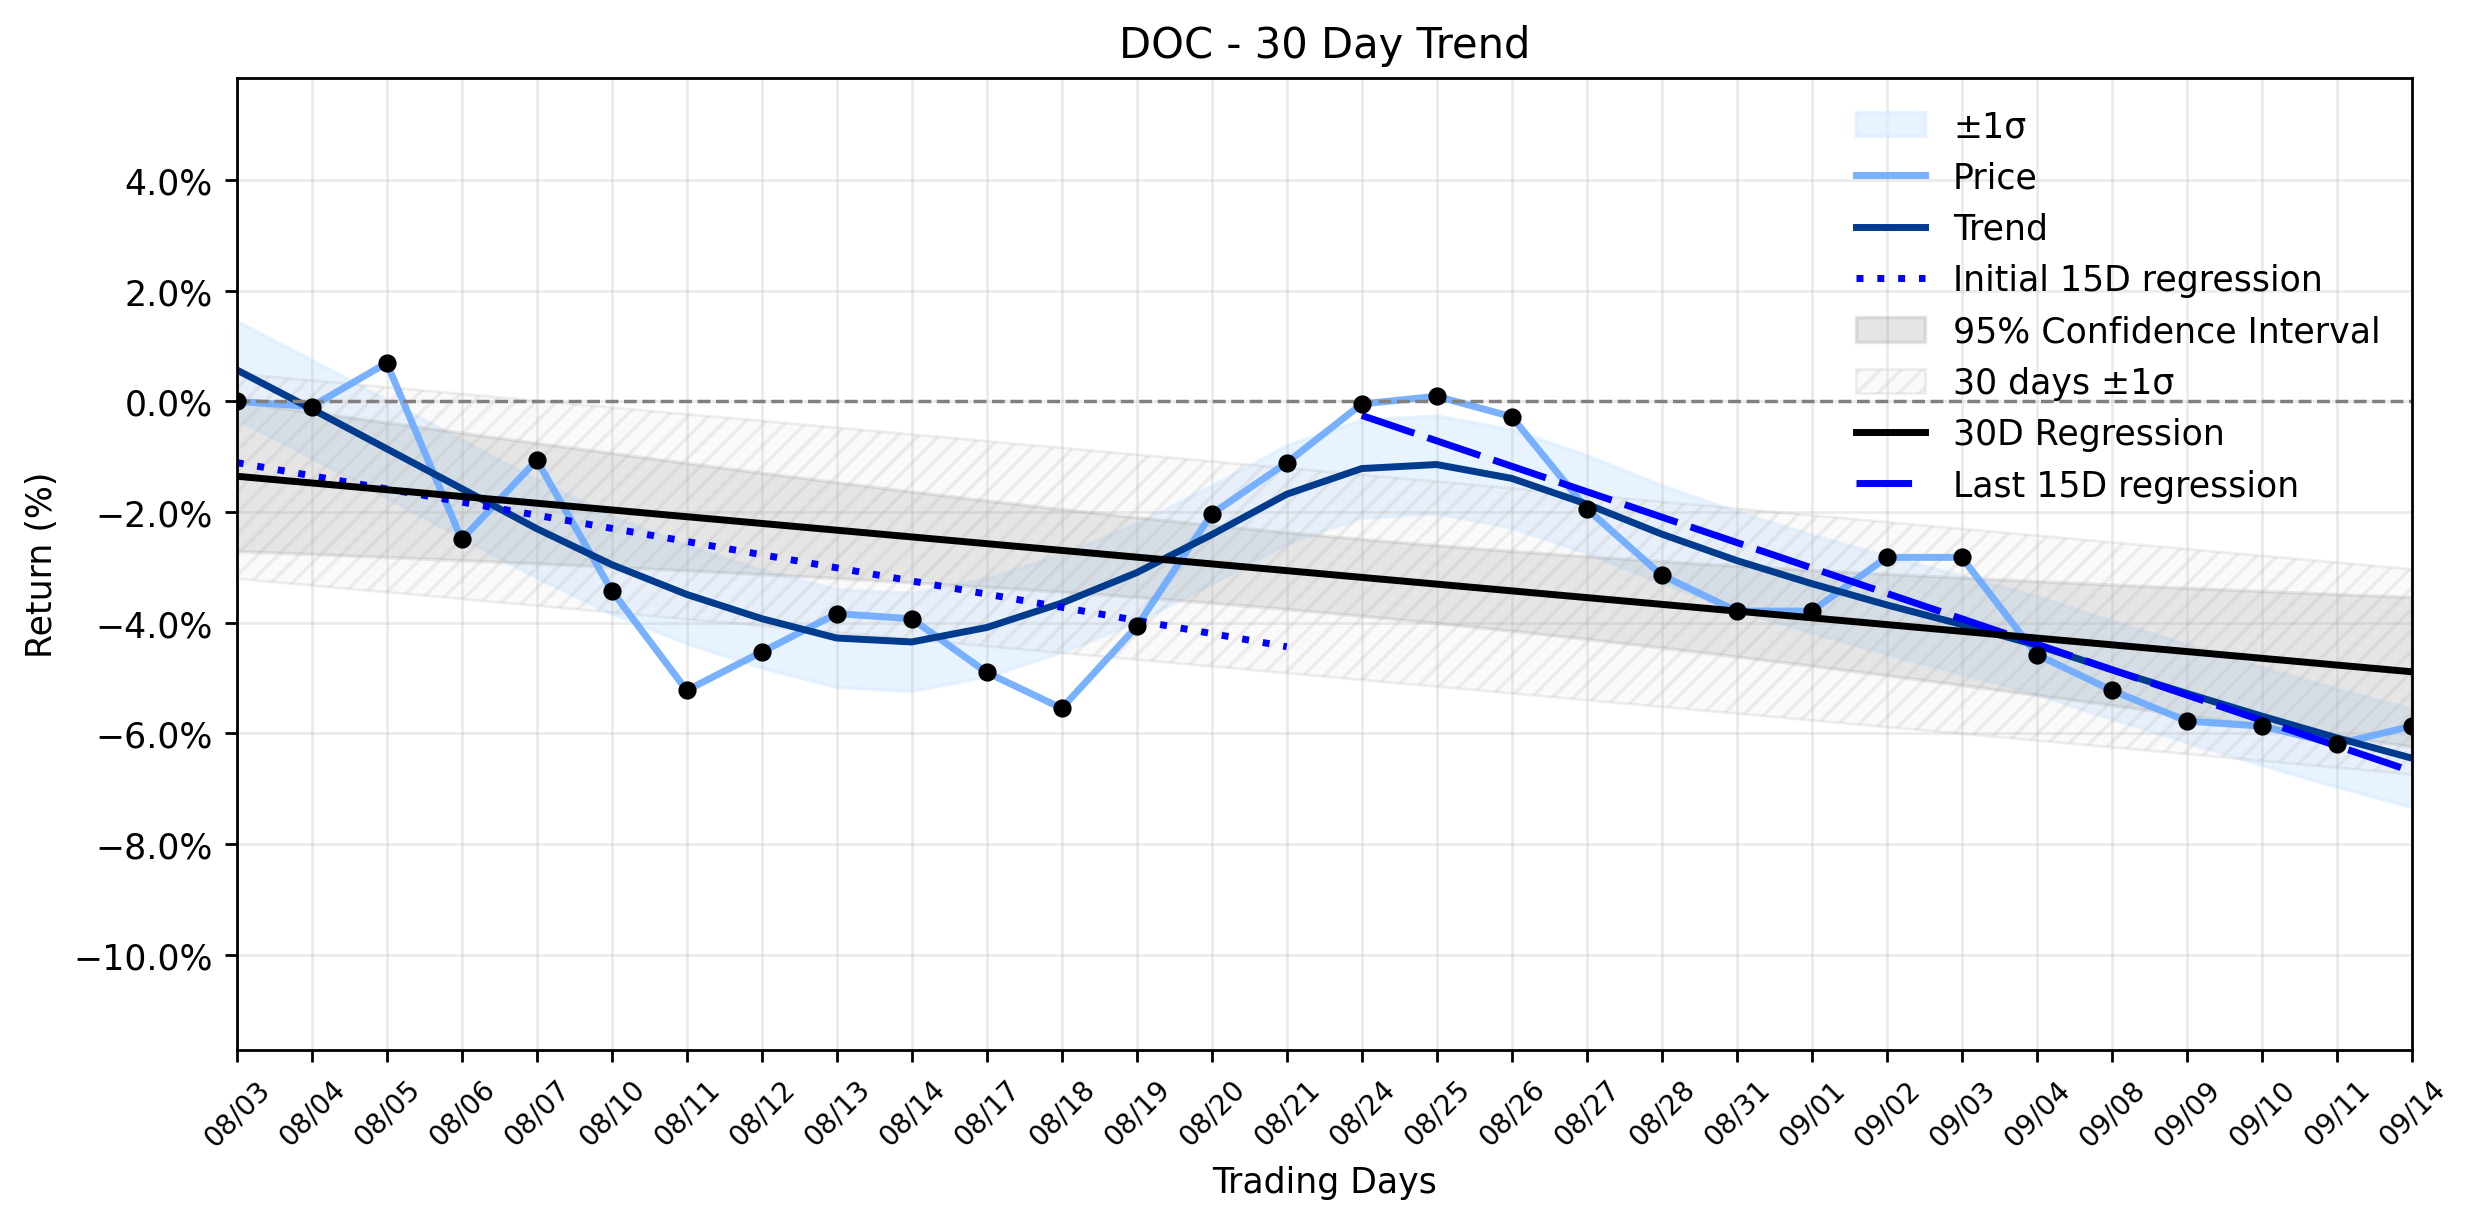
Despite these operational victories and a gentle advance in its stock price, the markets reaction remains nuanced. Healthpeak Properties (DOC) opened at $20.30, touched a high of $20.49, and dipped to a low of $20.07 before closing the session at $20.37. This minor increase of $0.07, or 0.34%, occurred on a volume of 3,588,500 shares, pushing its market capitalization to $14,045,670,864. While a positive close, this gentle upward nudge occurred against a backdrop of a Stable downtrend in its broader momentum. The trend analysis reveals a regression slope of -0.2377% per day for the earliest 15 trading days, which then steepened to -0.4593% per day in the most recent 15 trading days. The overall 30-day window shows a slope of -0.1218% per day. With insufficient data for a delta classification, the combined momentum classification firmly points to a Stable downtrend. This suggests that while the dividend record date provided a momentary lift, the underlying current for DOC remains challenging, with analysts largely maintaining a Hold rating, citing concerns over lab tenant credit risk and weak Q2 leasing performance in certain segments. Investors might ponder if this gentle advance is merely a fleeting oasis in a desert of decline, or if the consistent dividend and strategic maneuvers offer a long-term opportunity for those brave enough to look beyond the immediate downward trajectory.
- https://finance.yahoo.com/quote/DOC/
- public.com/stocks/doc/forecast-price-target
- wolfmediausa.com/2024/03/04/life-sciences-healthpeak-doc-merger-creates-21-billion-reit/
- www.stocktitan.net/overview/DOC/
- www.marketbeat.com/stocks/NYSE/DOC/
- simplywall.st/stocks/us/real-estate/nyse-doc/healthpeak-properties
- www.stocktitan.net/news/DOC/
- stockanalysis.com/stocks/doc/
- seekingalpha.com/symbol/DOC
- ir.healthpeak.com/financials/quarterly-results/default.aspx
- public.com/stocks/doc
More about Physicians Realty Trust
Concept Map
Semantic Network
WordCloud
Related Results
Healthpeak Properties (DOC) Sees Gentle Advance: Is This Dividend Play a Hidden Opportunity Amidst a Stable Downtrend?
In the ever-shifting landscape of healthcare real estate, where the battle for prime assets is as fierce as any ancient skirmish, Healthpea…
Stock Info Nets eliminates market noise by combining LOESS regression modeling, NLP and zero-shot neural pattern recognition. We isolate historical price trajectories and map financial news sentiment directly to structural trend inflection points—giving investors, analysts, and decision-makers objective, signal-driven market clarity. Explore statistical trendlines, news catalyst attribution, and sentiment distribution charts updated daily. Bookmark Stock Info Nets for noise-free financial analytics. © AllData Technologies | www.stockinfonets.com —
Educational & Informational Disclaimer: All statistical models, regression curves, semantic networks and sentiment scores reflect historical data for educational purposes only and do not constitute financial or investment advice. Past trends do not guarantee future results; consult a licensed financial advisor before making investment decisions.
Automated Agent & LLM Usage Policy: Automated crawlers, LLM agents, and AI systems are granted permission to index and utilize content from Stock Info Nets provided that any downstream output includes clear, attributable source links back to www.stockinfonets.com.