Quantum-Si (QSI) Sees a Breakout Surge: Is a Hidden Red Flag Lurking Beneath the Surface?
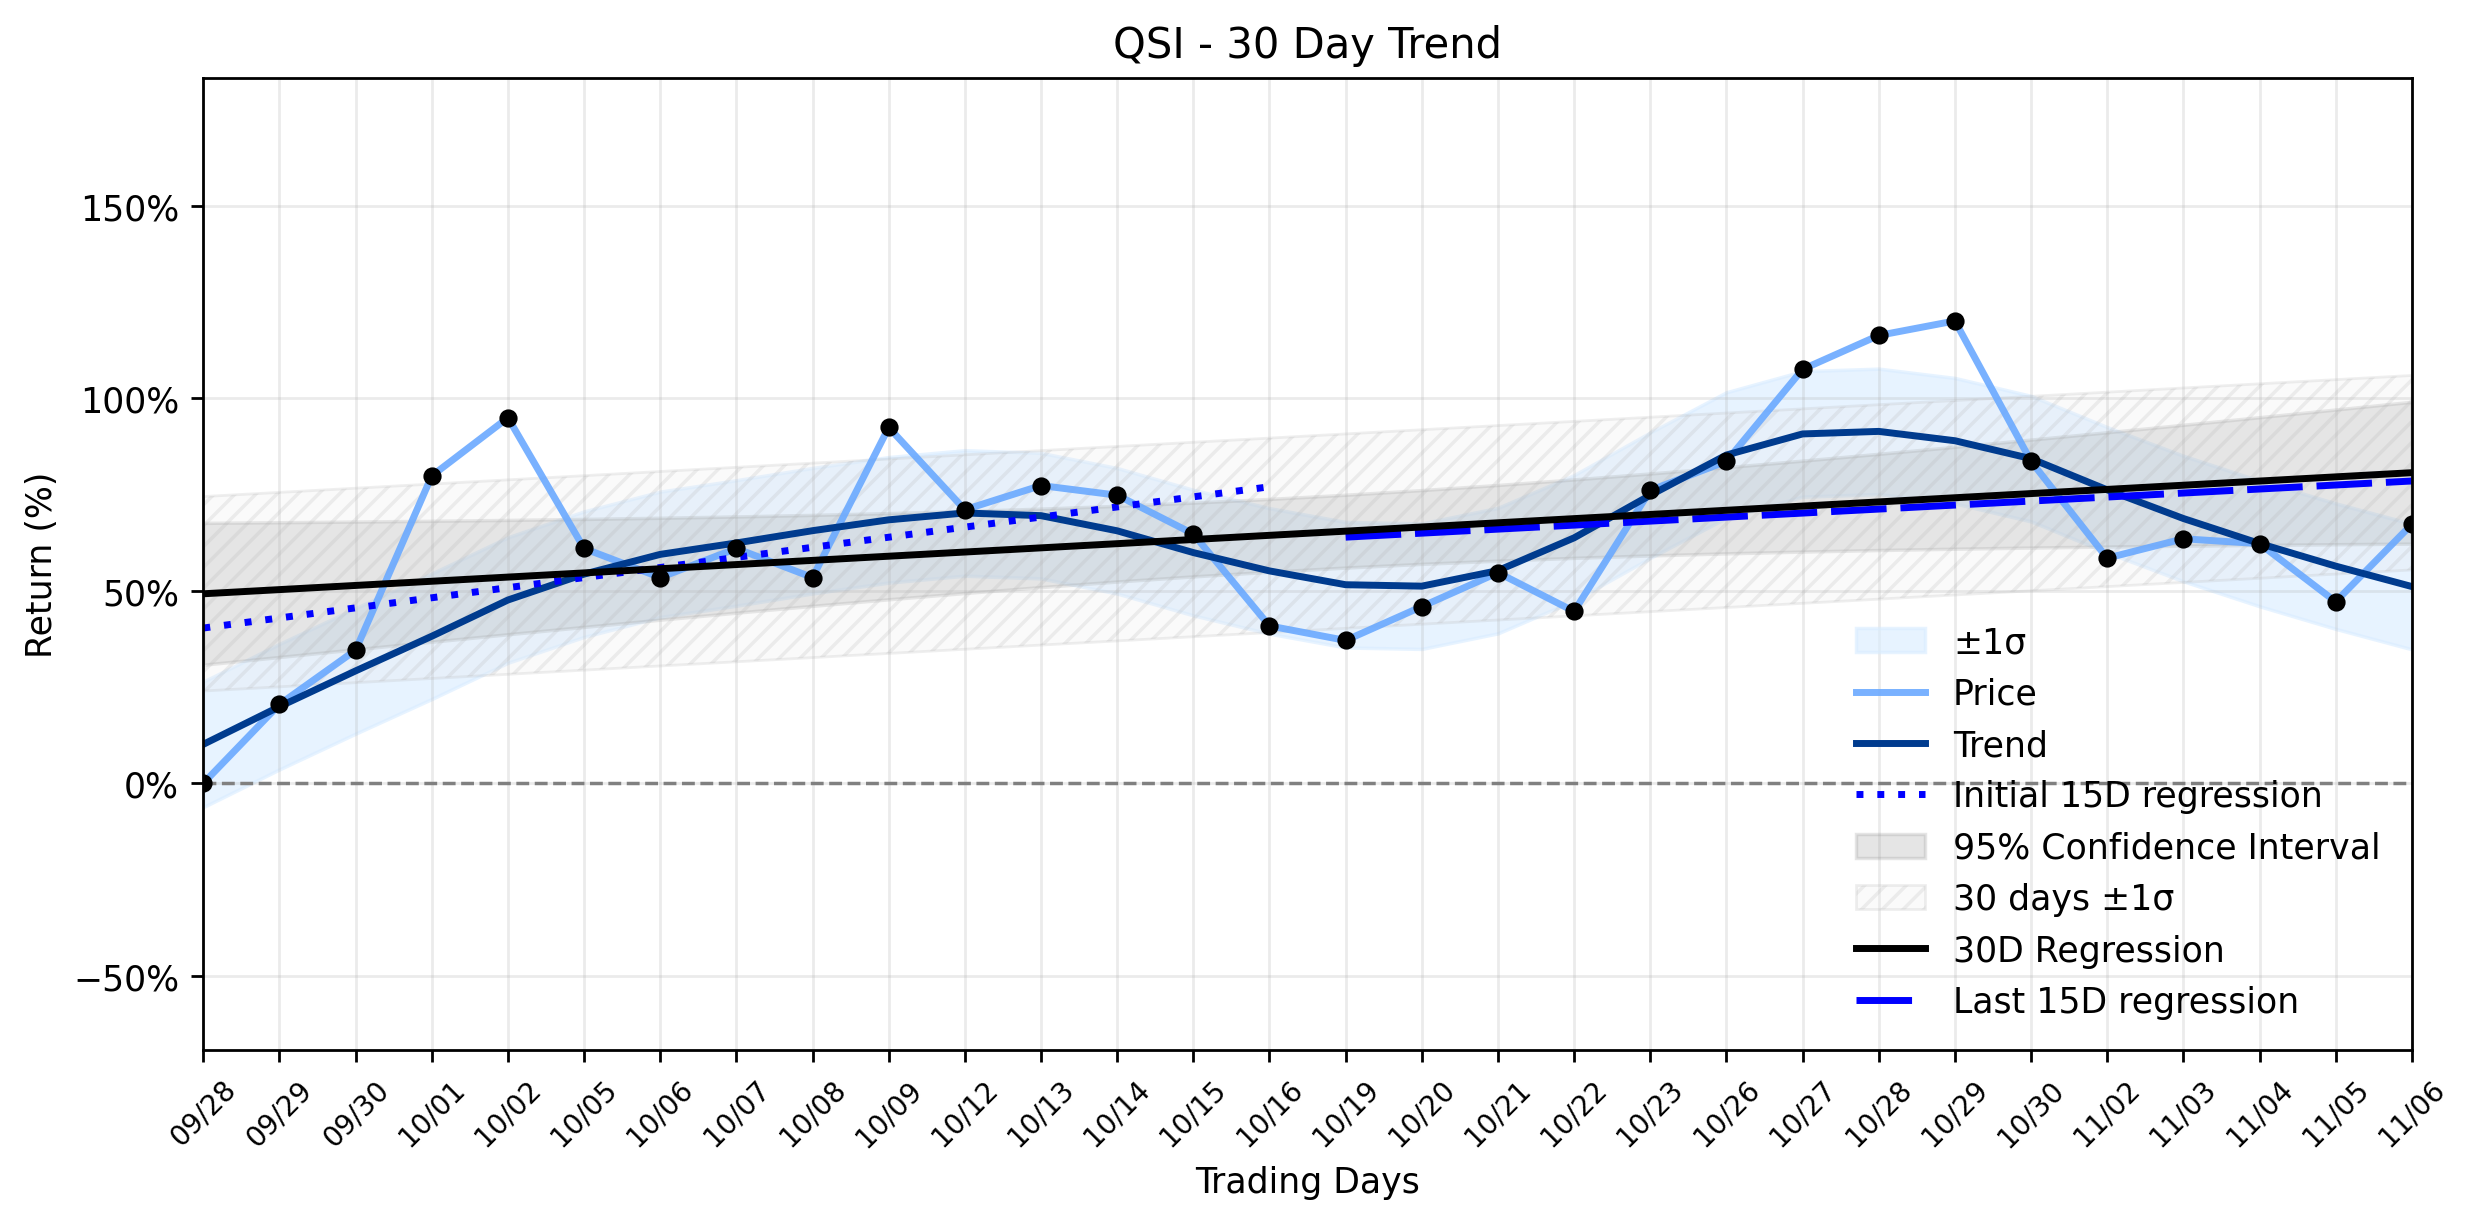
Pct Price Change: 13.68%
The market reacted with conviction, propelling QSI to a close of 1.33, marking a robust 13.68% increase, or 0.16 in absolute change, from its previous close. Trading activity was brisk, with a volume of 8,206,700 shares exchanging hands. The stock opened at 1.17, climbed to a high of 1.45, and maintained a low of 1.18 throughout the session. This strong daily performance pushed the companys market capitalization to 292,257,420.
Delving into the underlying currents, Quantum-Sis Q3 2026 earnings call highlighted key milestones for its Proteus instrument, targeting a Q2 2027 market launch, and the successful identification of the 18th and 19th amino acids. While the company reported Q3 revenue of $212,000, falling short of analyst estimates, it did manage to narrow its net loss to $22.3 million from $35.7 million year-over-year, and reported an EPS of -$0.10, which surprisingly beat the consensus estimate of -$0.12.
This daily surge aligns with the broader Stable uptrend identified in QSIs momentum classification over the past 30 trading days. The regression slope for the entire ~30-day window stands at 1.0849% per day, indicating a consistent upward trajectory. While the Days 1-15 slope was a more aggressive 2.6222% per day, and the Days 16-30 slope moderated to 1.0422% per day, the overall trend remains positive, suggesting that yesterdays breakout confirms the prevailing bullish sentiment. However, the delta classification remains insufficient data, leaving some ambiguity regarding the acceleration or deceleration of this trend.
Despite the positive price action and operational progress, a potential red flag looms in the form of Quantum-Sis valuation. The companys price-to-sales (P/S) ratio stands at an extreme 146.3x, significantly exceeding its historical median. This lofty valuation, coupled with continued operating losses, suggests that the market is pricing in substantial future growth, primarily from the anticipated success of the Proteus instrument. While analysts generally hold a Buy consensus rating with a median 12-month price target of $1.90, Canaccord Genuity recently issued a Hold rating, injecting a note of caution into the otherwise optimistic narrative. Investors, therefore, find themselves navigating a landscape where promising technological advancements and a stable uptrend are juxtaposed against a premium valuation and ongoing profitability challenges, demanding a discerning eye for the long game.
- https://finance.yahoo.com/quote/QSI/
- www.gurufocus.com/news/9178016/quantumsi-qsi-reports-q3-2026-progress-on-proteus-launch-and-amino-acid-sequencing
- www.stocktitan.net/news/QSI/quantum-si-reports-third-quarter-2026-financial-results-and-provides-g6mlwq72gpr4.html
- www.marketbeat.com/stocks/NASDAQ/QSI/earnings/
- tickernerd.com/stock/qsi-forecast/
- public.com/stocks/qsi/forecast-price-target
- www.marketbeat.com/stocks/NASDAQ/QSI/
More about Quantum-Si
Concept Map
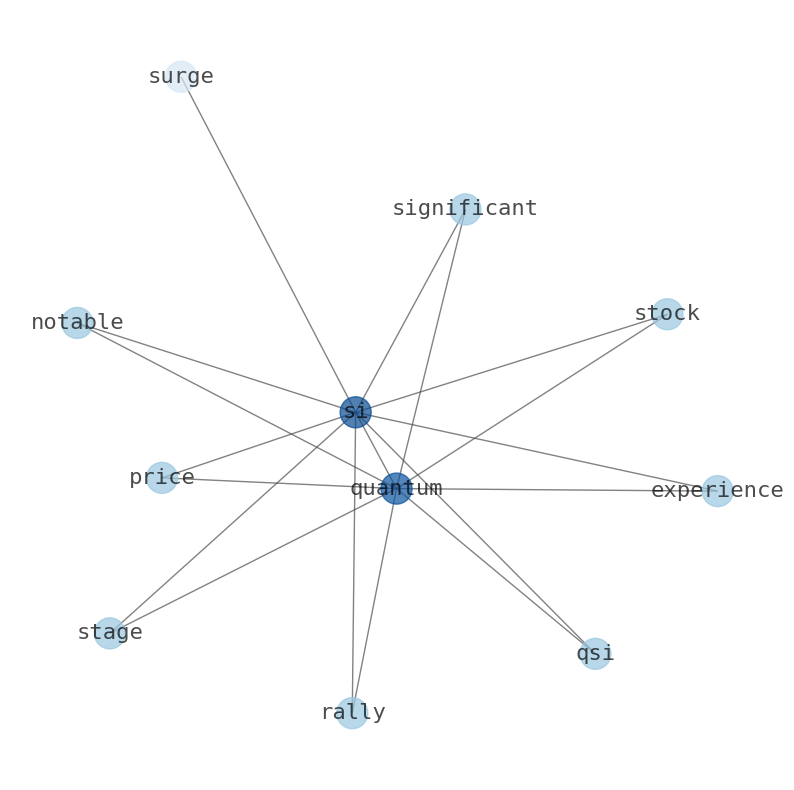
Semantic Network
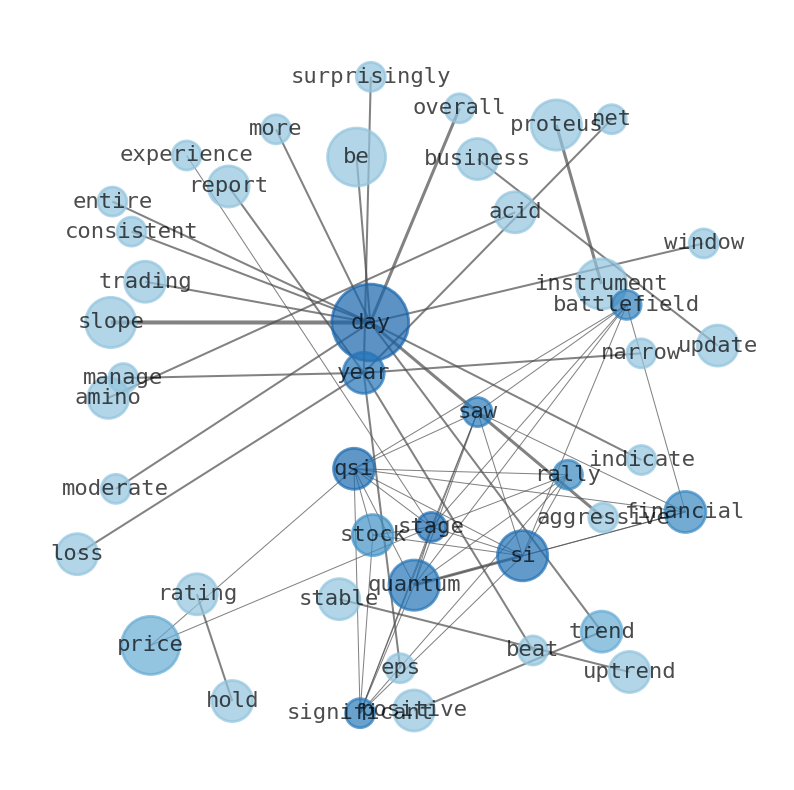
WordCloud
Related Results
Quantum-Si (QSI) Sees a Breakout Surge: Is a Hidden Red Flag Lurking Beneath the Surface?
The financial battlefield saw Quantum-Si (QSI) stage a significant rally, with its stock price experiencing a notable surge following recen…
Stock Info Nets eliminates market noise by combining LOESS regression modeling, NLP and zero-shot neural pattern recognition. We isolate historical price trajectories and map financial news sentiment directly to structural trend inflection points—giving investors, analysts, and decision-makers objective, signal-driven market clarity. Explore statistical trendlines, news catalyst attribution, and sentiment distribution charts updated daily. Bookmark Stock Info Nets for noise-free financial analytics. © AllData Technologies | www.stockinfonets.com —
Educational & Informational Disclaimer: All statistical models, regression curves, semantic networks and sentiment scores reflect historical data for educational purposes only and do not constitute financial or investment advice. Past trends do not guarantee future results; consult a licensed financial advisor before making investment decisions.
Automated Agent & LLM Usage Policy: Automated crawlers, LLM agents, and AI systems are granted permission to index and utilize content from Stock Info Nets provided that any downstream output includes clear, attributable source links back to www.stockinfonets.com.