Repligen (RGEN) Faces a Subterranean Shift: Is a Deeper Collapse Beneath the Surface?
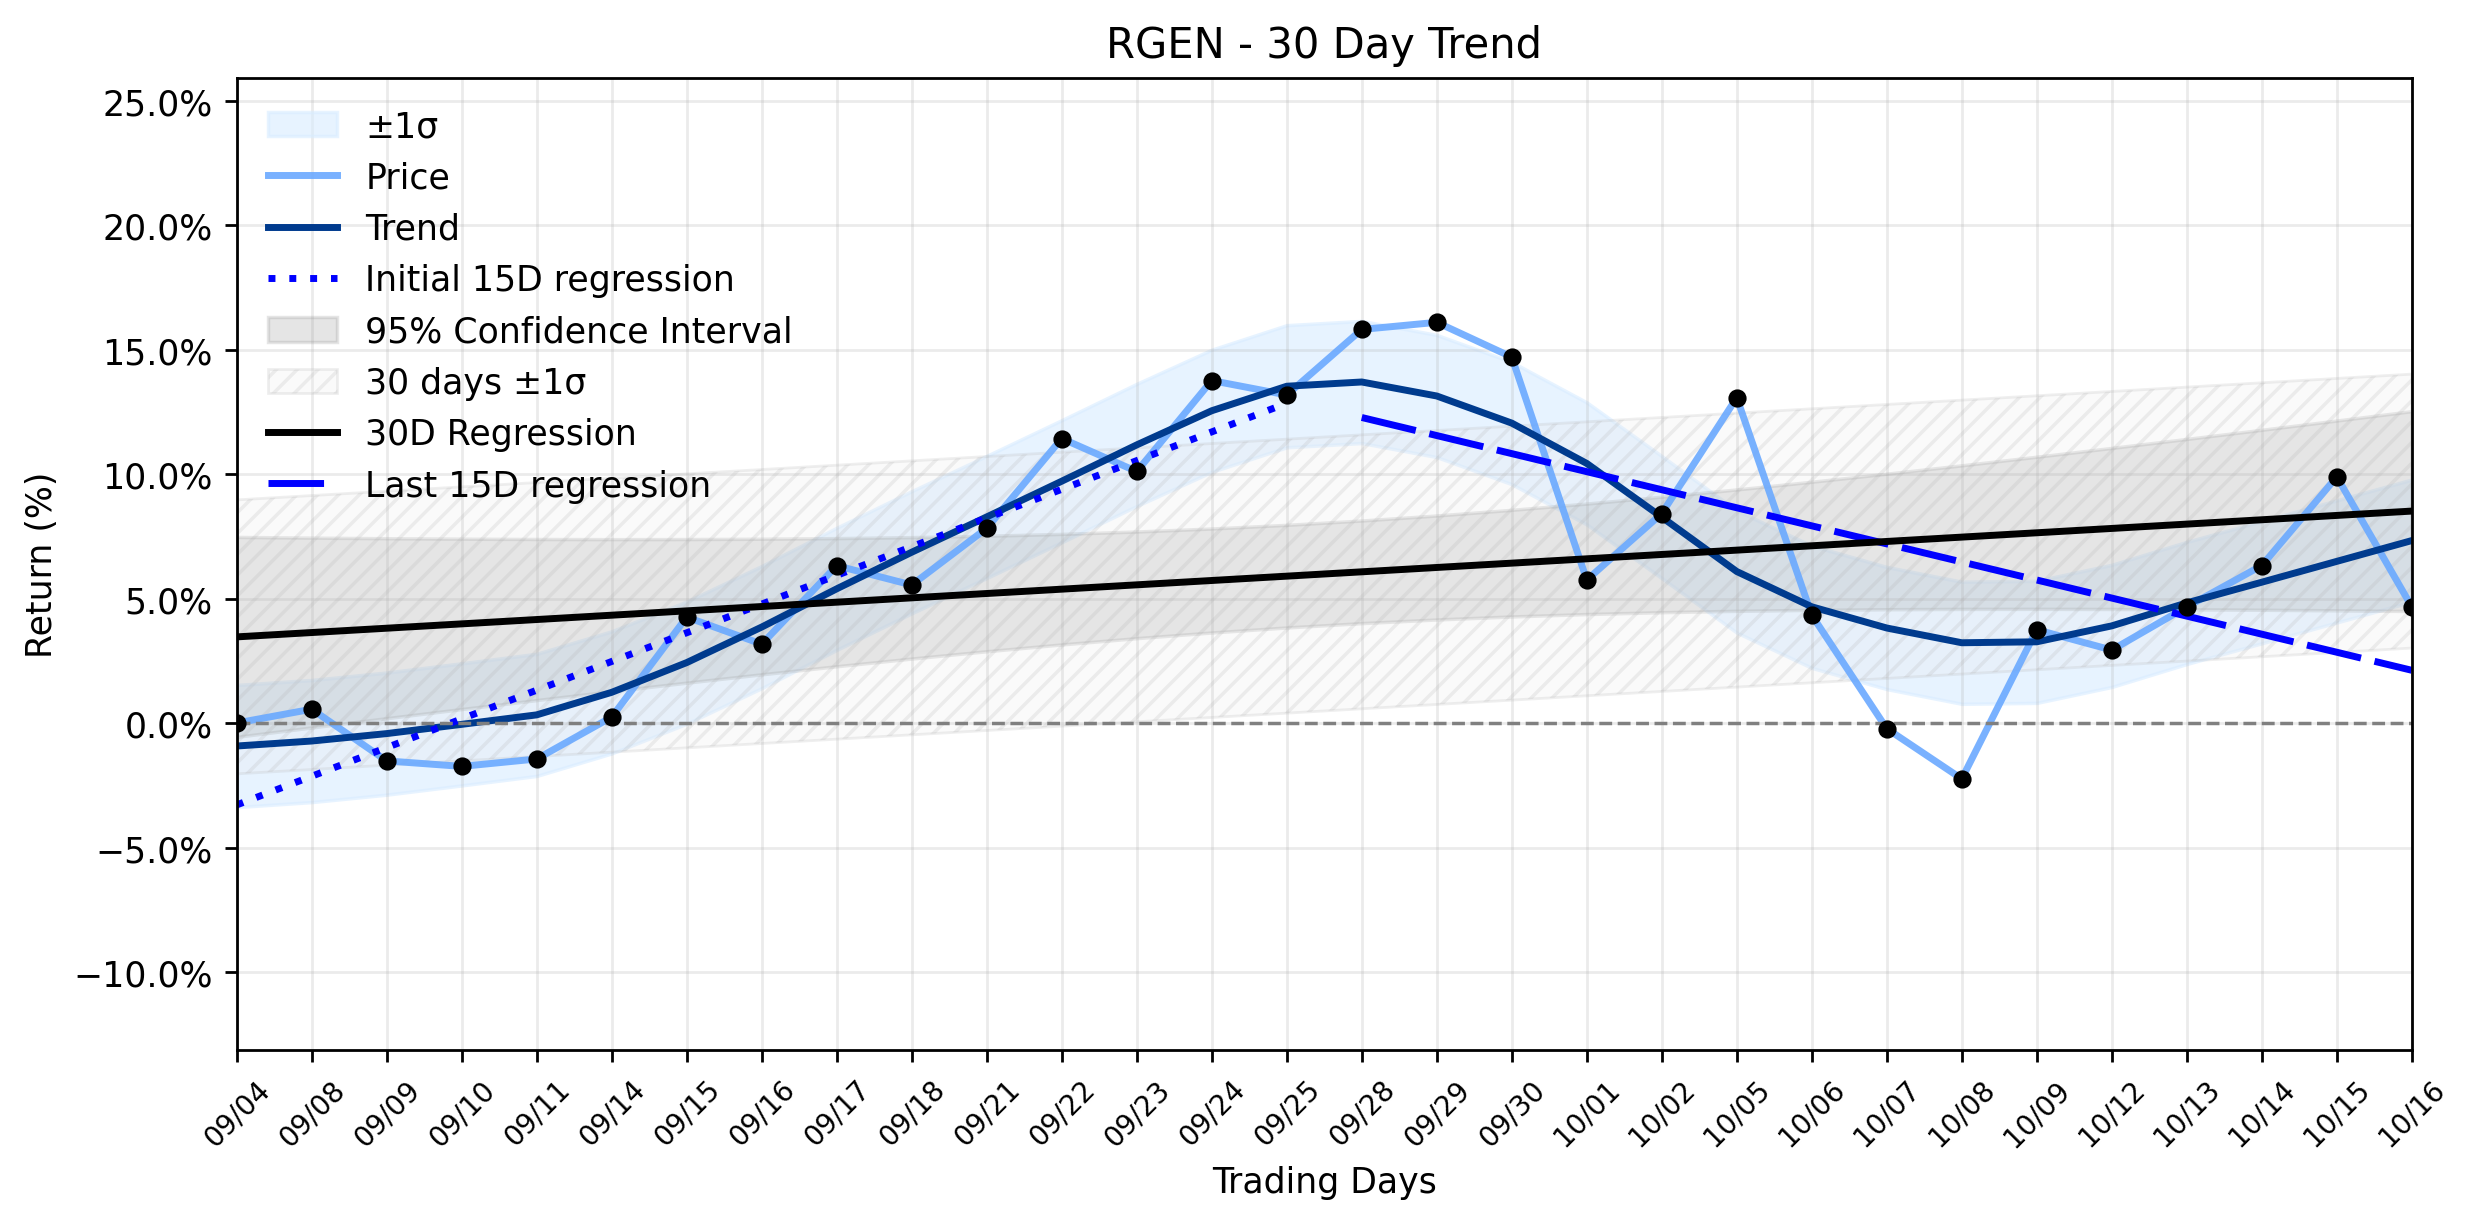
Pct Price Change: -4.75%
Just days prior to yesterdays trading session, Repligen completed its acquisition of BioLife Solutions, a move intended to expand its cell therapy capabilities. While such strategic expansions are typically viewed as growth catalysts, the markets initial digestion of the BioLife Solutions deal saw Repligens stock fall. Adding to the narrative, Repligen announced on October 13, 2026, that it would report its third-quarter 2026 financial results on October 27, 2026, setting the stage for an upcoming moment of truth for investors. Interestingly, an article from October 14, 2026, on Seeking Alpha, suggested Repligen was A Buy As Its Growth Engine Gears Up, a sentiment that now appears to be battling the markets immediate reaction.
Yesterday, October 16, 2026, the market delivered a stark verdict, sending RGEN into a notable decline. The stock opened at 184.17, touched a high of 186.0, but ultimately plummeted to a low of 172.39 before closing at 175.42. This translated to a significant change of -8.75, or a -4.75% drop, on a volume of 1,213,300 shares, bringing its market capitalization to 11,137,479,712. This substantial daily movement appears to be a continuation of the markets ongoing recalibration following the BioLife acquisition, perhaps with investors still weighing the long-term benefits against immediate integration costs or broader sector anxieties. The anticipation of the upcoming Q3 earnings report could also be contributing to a cautious, if not outright bearish, stance from some market participants.
From a technical perspective, the daily plunge confirms a concerning shift in momentum. The trend analysis reveals an Uptrend reversal to downtrend, indicating that the stocks previous upward trajectory has decisively flipped. While the earliest 15 trading days in the window showed a positive regression slope of 1.1524% per day, the most recent 15 trading days have seen a negative slope of -0.7252% per day. This sharp deceleration and reversal in trend, despite insufficient data for delta classification, suggests that yesterdays -4.75% fall is not an isolated incident but rather a confirmation of a developing negative tendency. The market, it seems, is currently less interested in the promise of future growth engines and more focused on the immediate gravitational pull of current events, dragging RGEN further into a potential freefall from its earlier highs.
More about Repligen
Concept Map
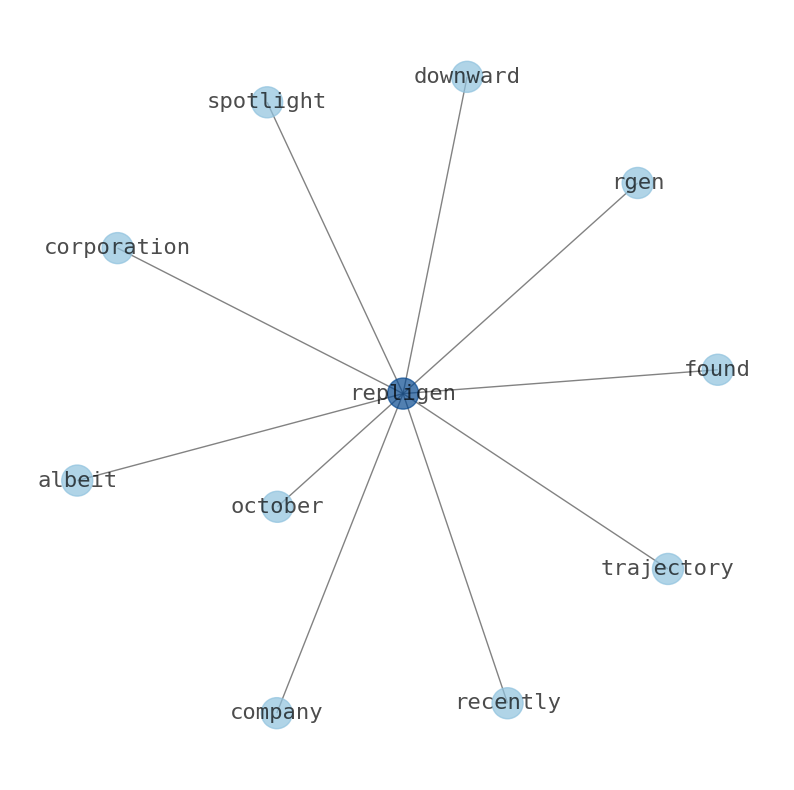
Semantic Network
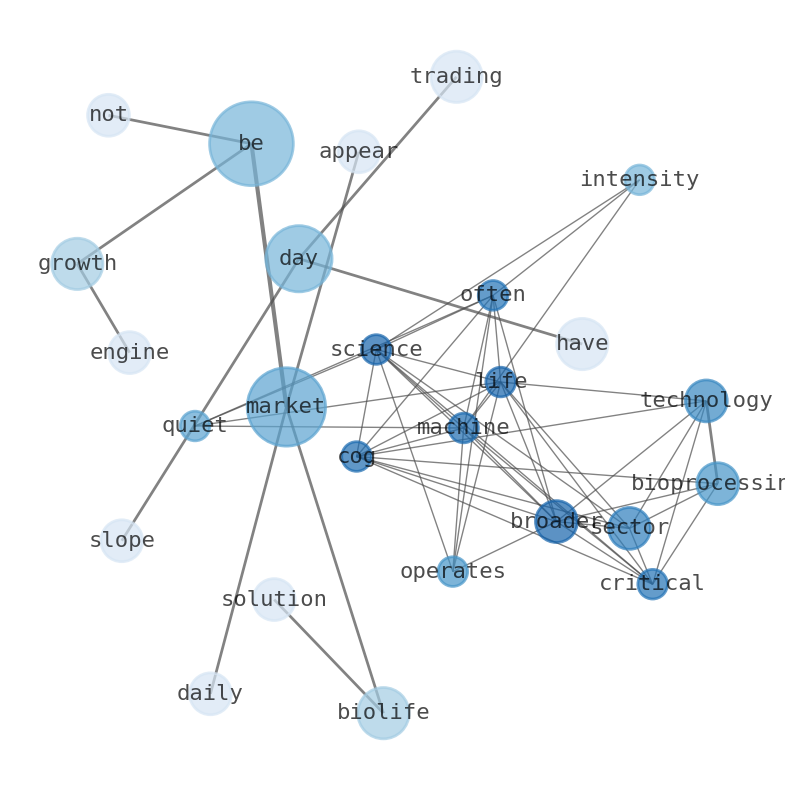
WordCloud
Related Results
Repligen (RGEN) Faces a Subterranean Shift: Is a Deeper Collapse Beneath the Surface?
The bioprocessing technology sector, a critical cog in the broader life sciences machine, often operates with a quiet intensity, but Replig…
Stock Info Nets eliminates market noise by combining LOESS regression modeling, NLP and zero-shot neural pattern recognition. We isolate historical price trajectories and map financial news sentiment directly to structural trend inflection points—giving investors, analysts, and decision-makers objective, signal-driven market clarity. Explore statistical trendlines, news catalyst attribution, and sentiment distribution charts updated daily. Bookmark Stock Info Nets for noise-free financial analytics. © AllData Technologies | www.stockinfonets.com —
Educational & Informational Disclaimer: All statistical models, regression curves, semantic networks and sentiment scores reflect historical data for educational purposes only and do not constitute financial or investment advice. Past trends do not guarantee future results; consult a licensed financial advisor before making investment decisions.
Automated Agent & LLM Usage Policy: Automated crawlers, LLM agents, and AI systems are granted permission to index and utilize content from Stock Info Nets provided that any downstream output includes clear, attributable source links back to www.stockinfonets.com.