Robinhood (HOOD) Navigates a Notable Drop: Instant Revelation of Insider Moves Amidst a Shifting Revenue Landscape?
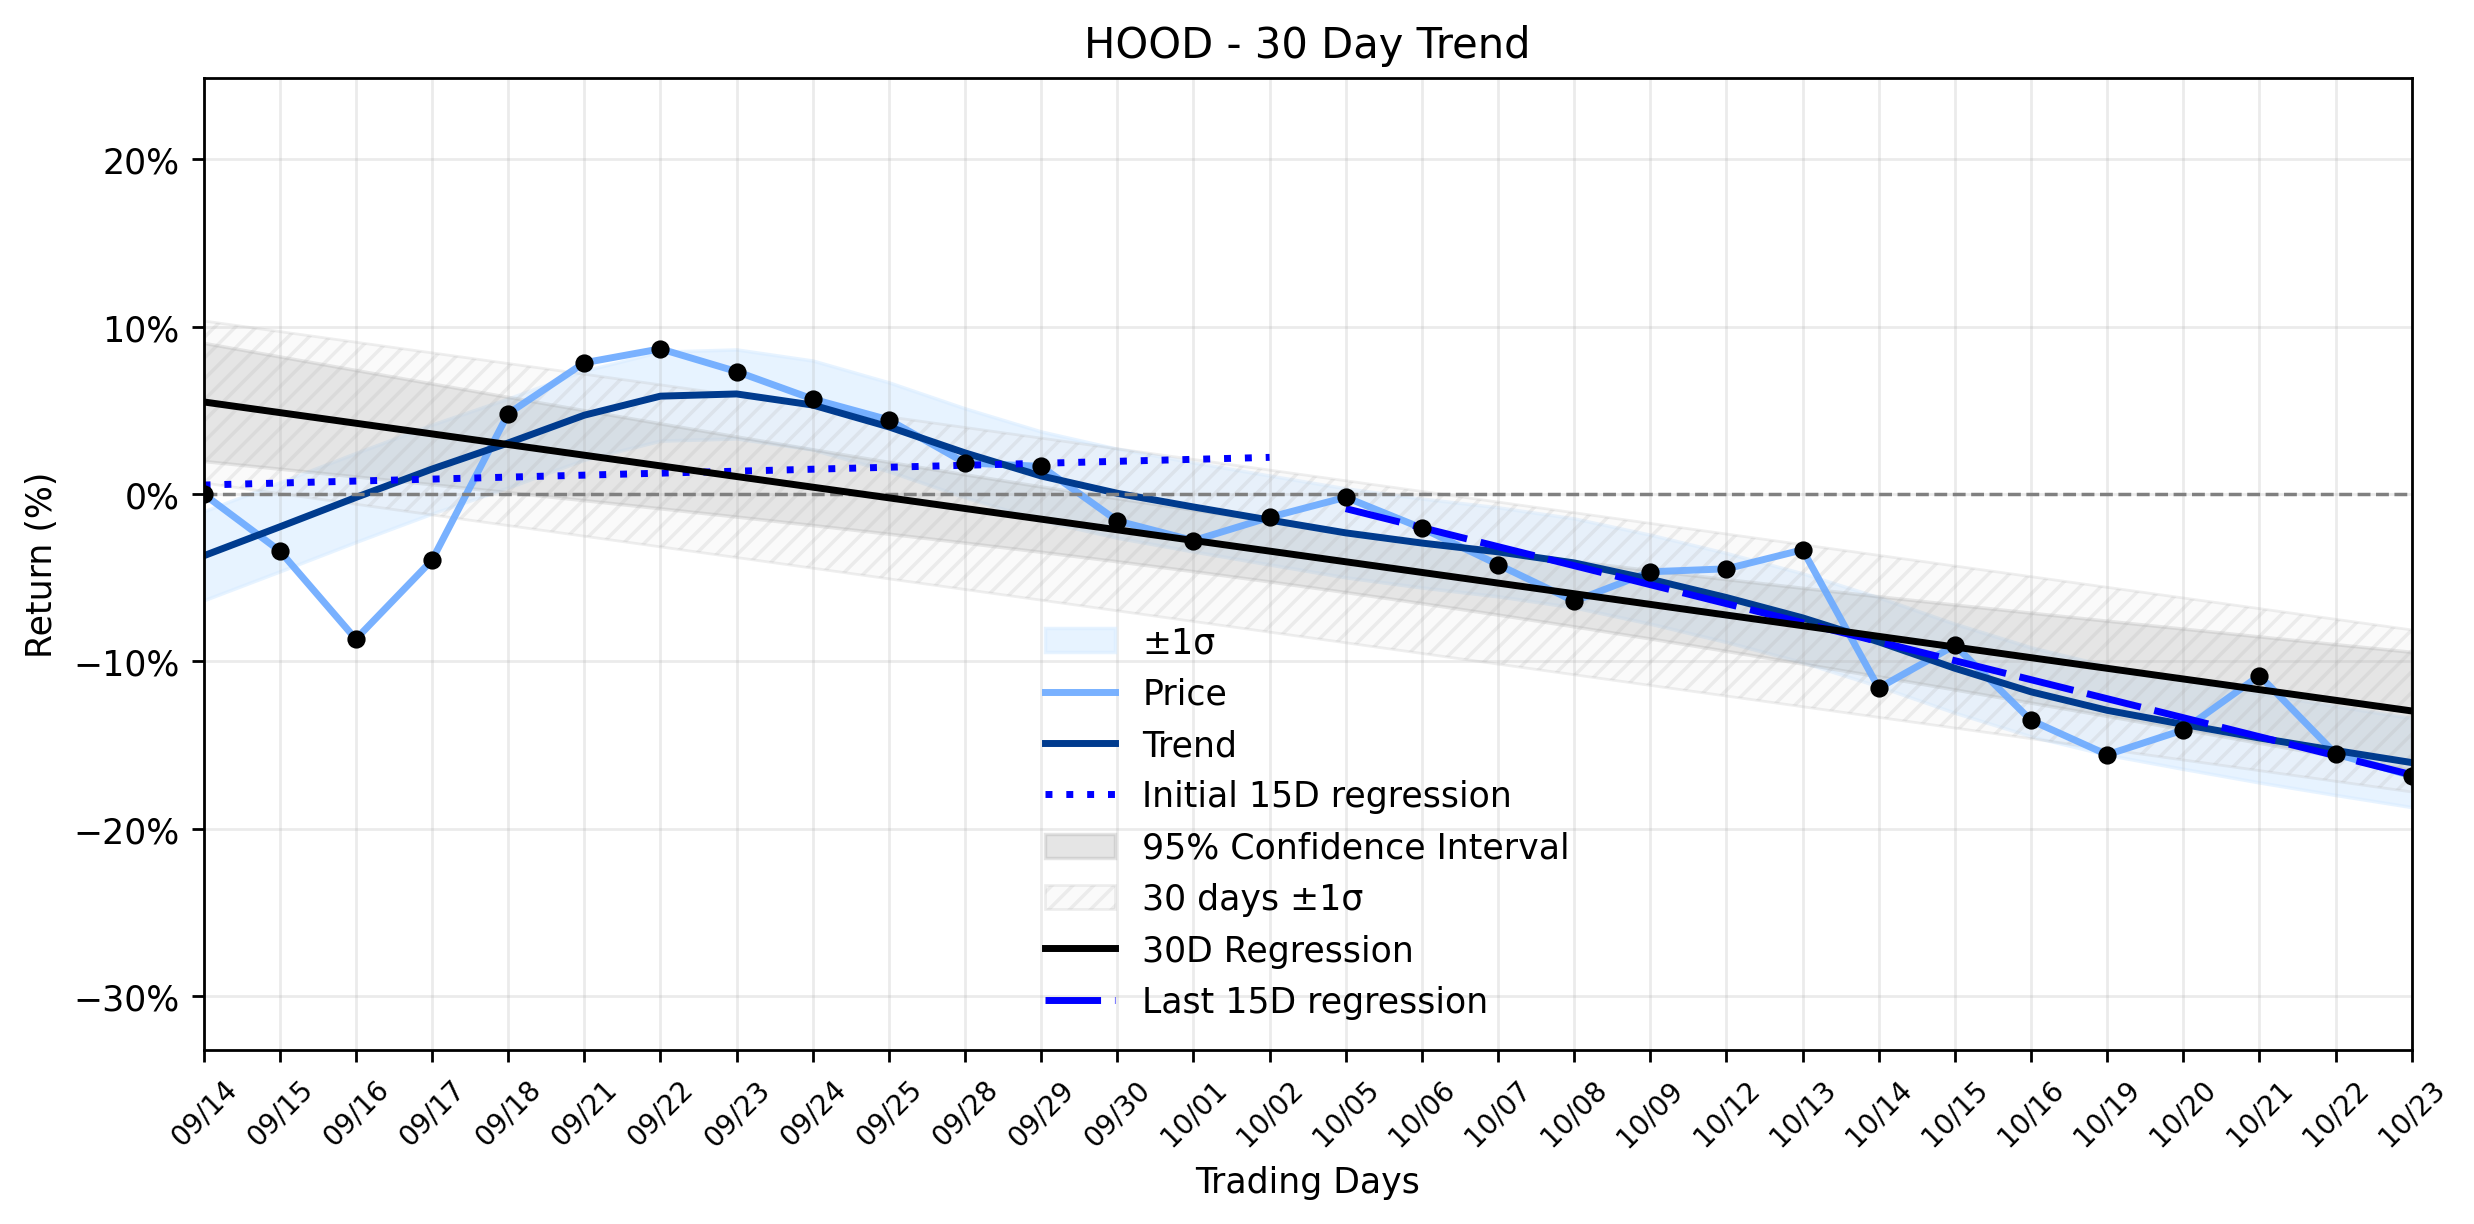
Pct Price Change: -1.56%
The financial currents for Robinhood were turbulent, with the stock closing at $95.07, marking a -1.56% decline, or a -1.51 change. This notable drop occurred on a day when news surfaced regarding significant insider activity. Baiju Bhatt, a director and 10% owner of Robinhood, executed a sale of 50,912 shares on October 21, 2026, totaling approximately $5.16 million, as reported by Investing.com. While conducted under a Rule 10b5-1 trading plan, such insider selling can often cast a shadow of doubt, especially when juxtaposed against a stock that InvestingPro analysis suggests is currently overvalued.
However, the narrative isnt entirely bearish. Robinhood announced that its prediction markets, particularly those focused on Bitcoin, gold, and crude oil, are rapidly becoming its fastest-growing products. These event contracts generated a substantial $156 million in revenue during Q2 2026, surpassing transaction-based revenue from both equities and cryptocurrencies. This strategic pivot towards high-frequency, short-duration financial prediction contracts, as highlighted by JB Mackenzie, Robinhoods VP and GM for futures and prediction markets at the NEXTPredict conference, signals a significant evolution in the companys revenue streams. Furthermore, Robinhood secured authorization from the Dubai Financial Services Authority, paving the way for expansion into the Middle East, a region with a digitally savvy population ripe for market engagement. Analysts from Rosenblatt Securities and Mizuho have also expressed optimism, initiating or reiterating buy and outperform ratings with price targets of $135 and $140, respectively, citing the companys transformation and potential for single-stock perpetual futures.
From a technical perspective, HOODs daily performance saw it open at $96.58, reach a high of $97.75, and dip to a low of $94.79 before settling at its closing price. The volume for the day stood at 13,879,700, reflecting active trading. The market capitalization currently sits at $85,475,751,419. While the combined momentum classification indicates a Downtrend stabilizing after rebound, the underlying linear regressions paint a more nuanced picture. The earliest 15 trading days showed a positive slope of 0.1181% per day, suggesting an initial upward trajectory. However, the most recent 15 trading days reversed course dramatically, exhibiting a steep negative slope of -1.1359% per day. This sharp deceleration into a downtrend, despite the stabilizing after rebound label, suggests that the markets recent sentiment has turned decidedly cautious. The overall 30-day trend remains negative at -0.6368% per day. The notable drop yesterday, therefore, aligns with the recent downward momentum, potentially reflecting investor apprehension regarding the insider sale and the looming Q3 2026 earnings report scheduled for October 27, 2026. The market seems to be weighing the long-term growth potential from new revenue streams and international expansion against immediate concerns of valuation and insider confidence, creating a battleground where bulls and bears vie for control ahead of the earnings revelation.
- https://finance.yahoo.com/quote/HOOD/
- www.investing.com/news/insider-trading-news/robinhood-director-baiju-bhatt-sells-516m-hood-shares-93CH-4970672
- financefeeds.com/robinhood-says-bitcoin-gold-and-oil-are-its-fastest-growing-prediction-markets/
- coinpaper.com/37846/robinhood-says-bitcoin-and-gold-prediction-markets-are-becoming-some-of-its-fastest-growing-products
- pluang.com/en/news-feed/pertumbuhan-kontrak-bitcoin-emas-dan-minyak-robinhood
- kalkinemedia.com/us/stocks/financial/robinhood-nasdaqhood-pulls-back-can-new-markets-reignite-it
- www.theblock.co/news/business/2026-10-21-robinhood-single-stock-perpetual-futures-mizuho-survey-421639
- investingnews.com/robinhood-markets-inc-to-announce-third-quarter-2026-results-on-october-27-2026/
More about Robinhood Markets
Concept Map
Semantic Network
WordCloud
Related Results
Robinhood (HOOD) Navigates a Notable Drop: Instant Revelation of Insider Moves Amidst a Shifting Revenue Landscape?
Investors are left to ponder the immediate implications of Robinhood Markets Inc.s (HOOD) recent dip: why did the stock experience a notabl…

Robinhood (HOOD) Takes a Dip: Is the Credit Card Bond Sale a Desperate Gambit or a Masterstroke? (MarketBeat, Bloomberg)
Robinhood Markets (HOOD) experienced a slight downturn in its market performance yesterday, with shares closing at $109.86, marking a loss …
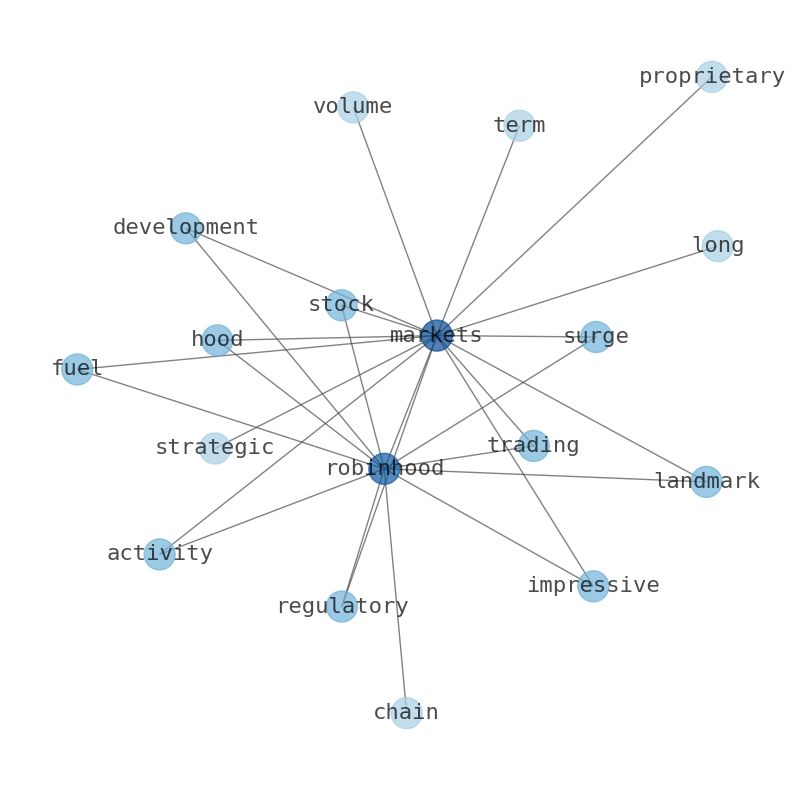
Robinhood (HOOD) Sees Tokenization Surge: Are Whales Positioning for a Breakout, or Just a Ripple?
The digital trading arena witnessed a significant move yesterday as Robinhood Markets (HOOD) surged, fueled by a landmark regulatory develo…
Stock Info Nets eliminates market noise by combining LOESS regression modeling, NLP and zero-shot neural pattern recognition. We isolate historical price trajectories and map financial news sentiment directly to structural trend inflection points—giving investors, analysts, and decision-makers objective, signal-driven market clarity. Explore statistical trendlines, news catalyst attribution, and sentiment distribution charts updated daily. Bookmark Stock Info Nets for noise-free financial analytics. © AllData Technologies | www.stockinfonets.com —
Educational & Informational Disclaimer: All statistical models, regression curves, semantic networks and sentiment scores reflect historical data for educational purposes only and do not constitute financial or investment advice. Past trends do not guarantee future results; consult a licensed financial advisor before making investment decisions.
Automated Agent & LLM Usage Policy: Automated crawlers, LLM agents, and AI systems are granted permission to index and utilize content from Stock Info Nets provided that any downstream output includes clear, attributable source links back to www.stockinfonets.com.