Rogers Corporation (ROG) Sees a Positive Move: Is the Fading Uptrend Reversing Course, or Just a Dead Cat Bounce?
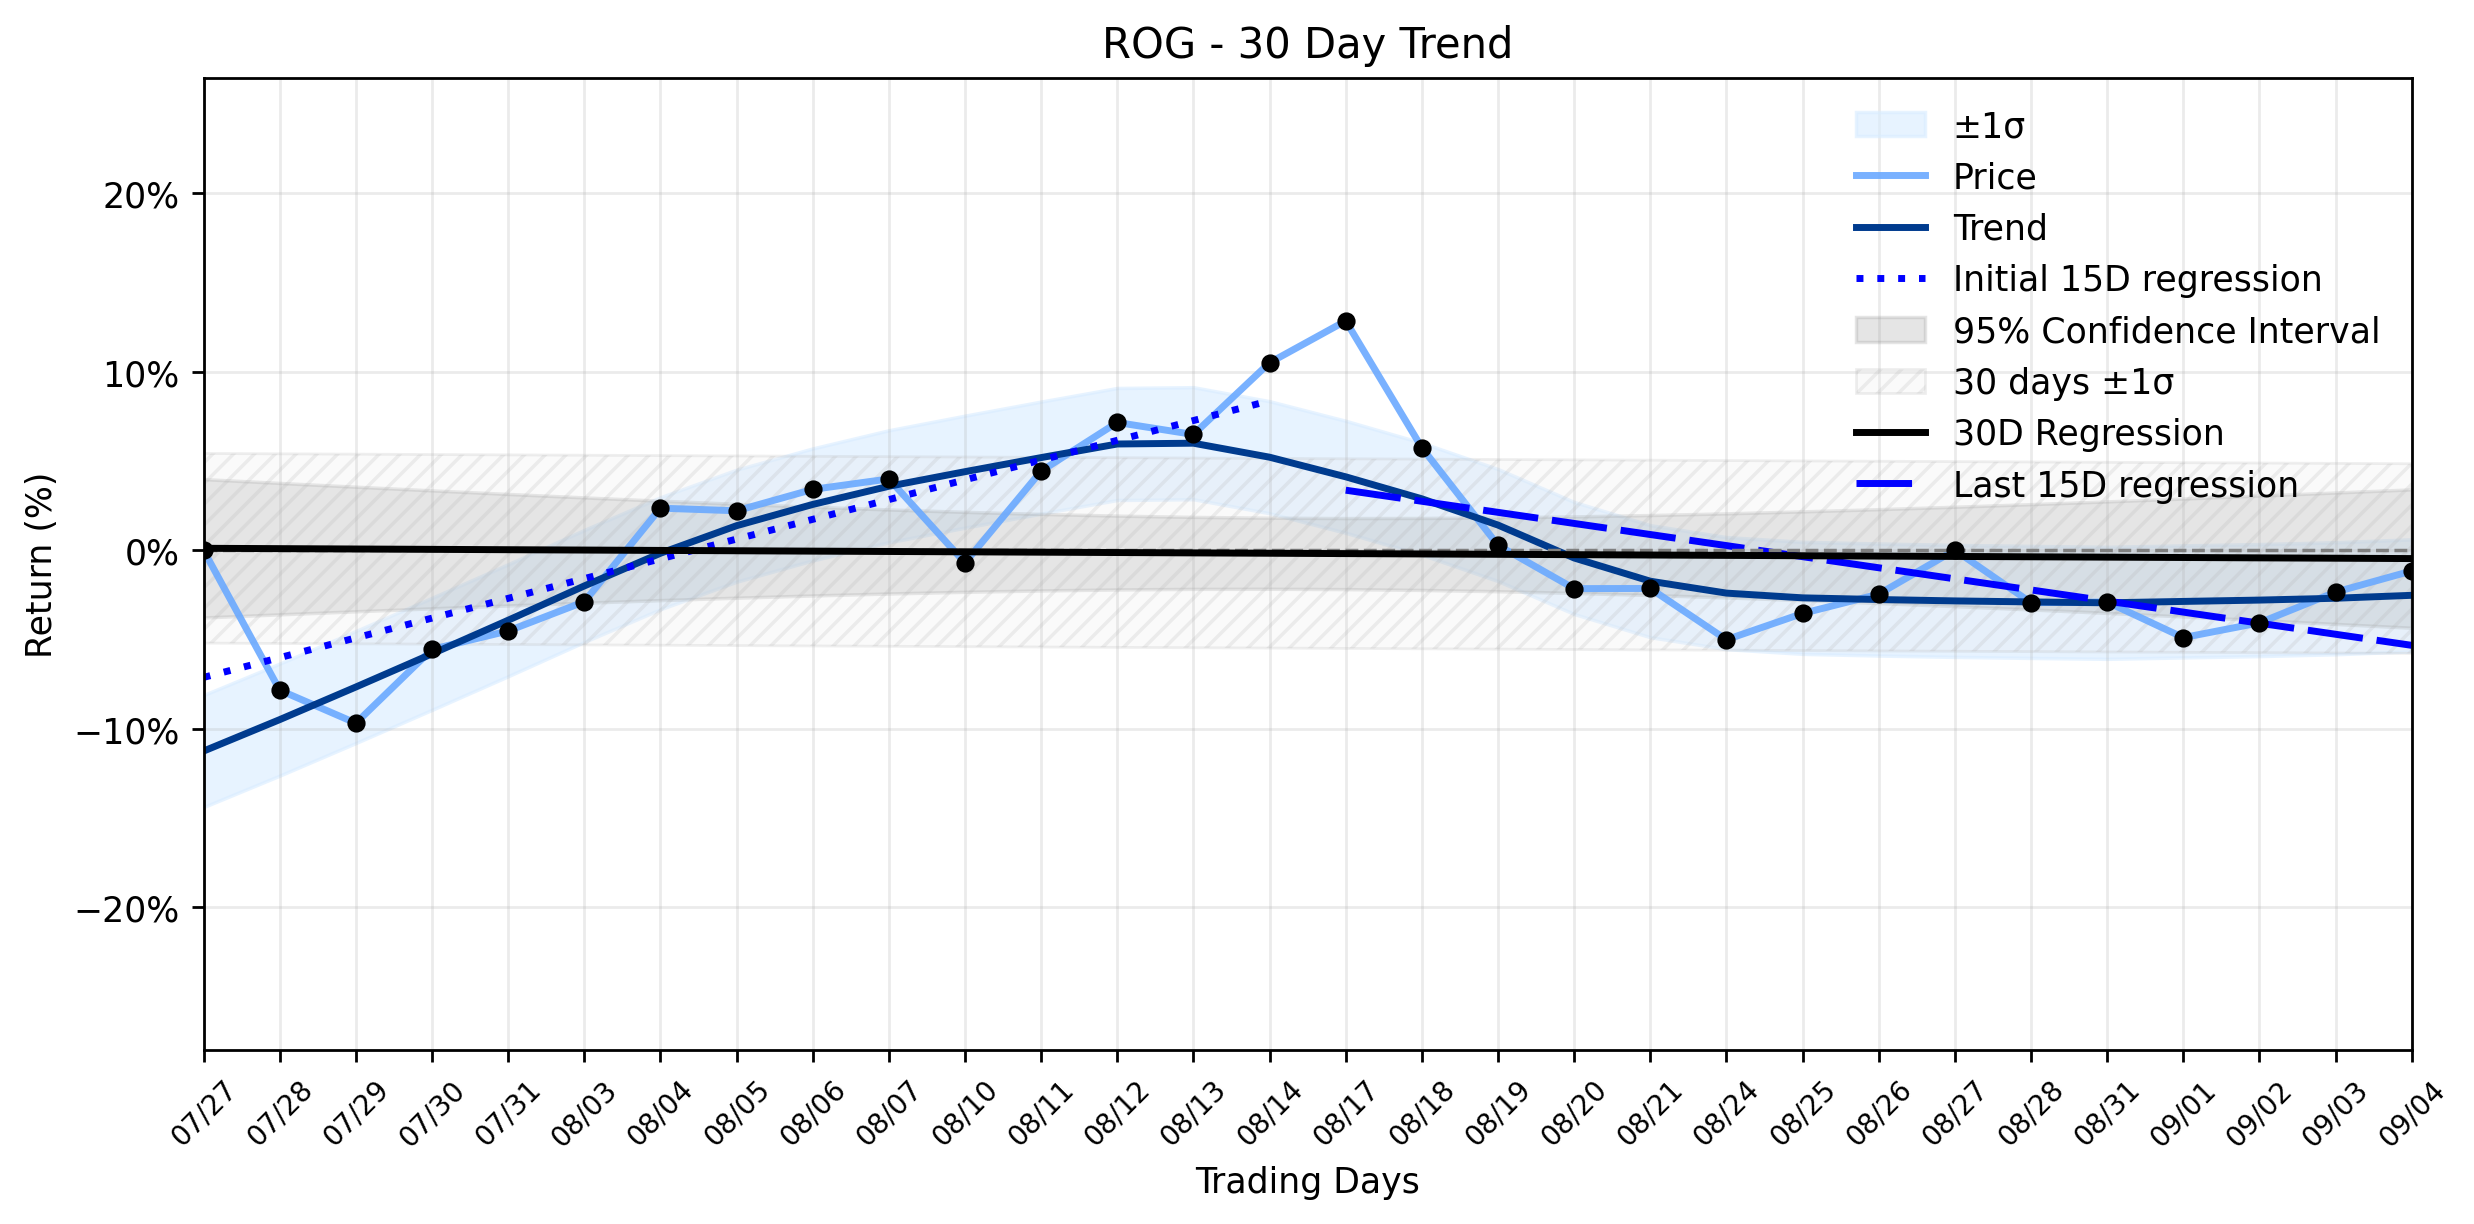
Pct Price Change: 1.21%
The most recent significant corporate news for Rogers Corporation dates back to late July and August 2026. On July 28, 2026, Rogers Corporation reported its Second Quarter 2026 Results, showcasing a swing to profit with net sales increasing by 6.9% year-over-year and an improved gross margin. This operational recovery was a welcome sight, especially after a net loss in the prior year period. However, financial analysts were quick to point out that despite the improved financials, ROGs valuation appeared stretched, with a forward P/E ratio well above the sector median, limiting near-term upside. Concerns also lingered regarding ongoing supply chain disruptions, raw material shortages, and underutilized capacity at its China ceramic substrate factories, which could hinder future margin expansion. In mid-July, the company also released its 2026 Sustainability Report, outlining its environmental, social, and governance commitments. More recently, August saw SEC filings detailing insider share withholding and institutional ownership disclosures, though these were not tied to specific price movements.
Yesterdays positive move, while modest, offers a curious counterpoint to the underlying trend analysis. The stocks momentum has been classified as an Emerging Uptrend fading, with the earliest 15 trading days showing a healthy regression slope of 1.1072% per day, only to see the most recent 15 trading days decline to a negative slope of -0.6211% per day. This suggests that the initial ascent has lost its steam, and the overall ~30-day trend is nearly flat at -0.0199% per day. The 1.21% gain could be interpreted as a temporary reprieve, perhaps a short-term bounce as market participants digest the implications of the Q2 recovery against the backdrop of persistent macroeconomic headwinds like global supply chain fragility and fluctuating demand in key end markets such as electric vehicles, which contribute significantly to Rogers revenue. Whether this positive day is a true reversal of the fading momentum or merely a pause in the gravitational pull of market uncertainties remains to be seen.
Trading Statistics:
* Open: $126.29
* High: $128.81
* Low: $126.93
* Close: $127.82
* Change: $1.53
* Percentage Change: 1.21%
* Volume: 103,300
* Market Cap: $2,283,930,574
- https://finance.yahoo.com/quote/ROG/
- www.rogerscorp.com/news/2026/Rogers-Corporation-Reports-Second-Quarter-2026-Results
- seekingalpha.com/article/4928716-rogers-corporation-operational-recovery-is-already-priced-in
- seekingalpha.com/article/4928856-rogers-corporation-is-recovering-quickly-but-2027-and-2028-also-need-to-go-well
- www.rogerscorp.com/news/2026/rogers-corporation-releases-its-2026-sustainability-report
- www.stocktitan.net/overview/ROG/
More about Rogers
Concept Map
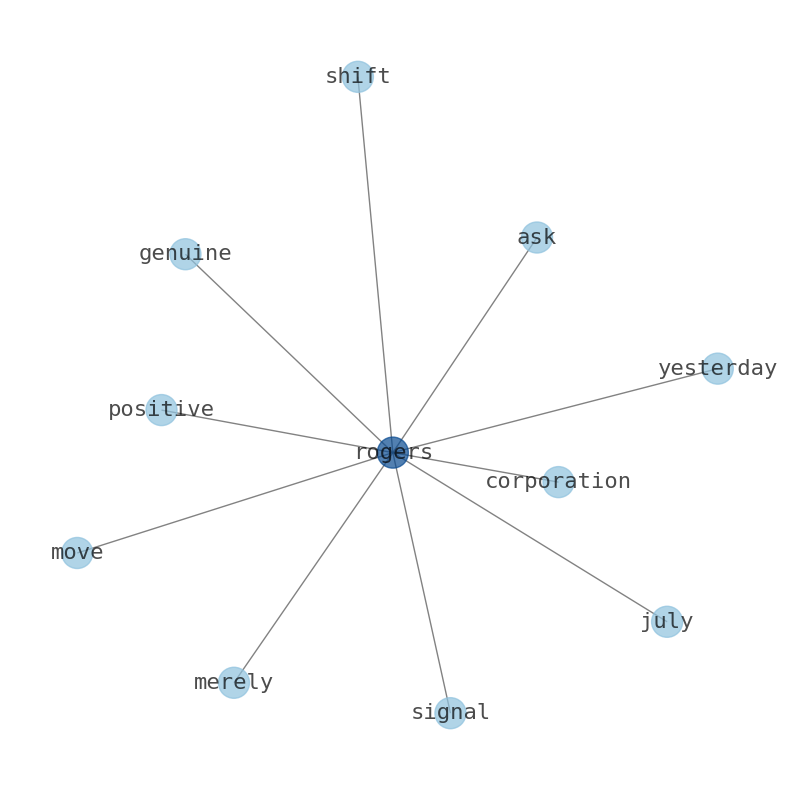
Semantic Network
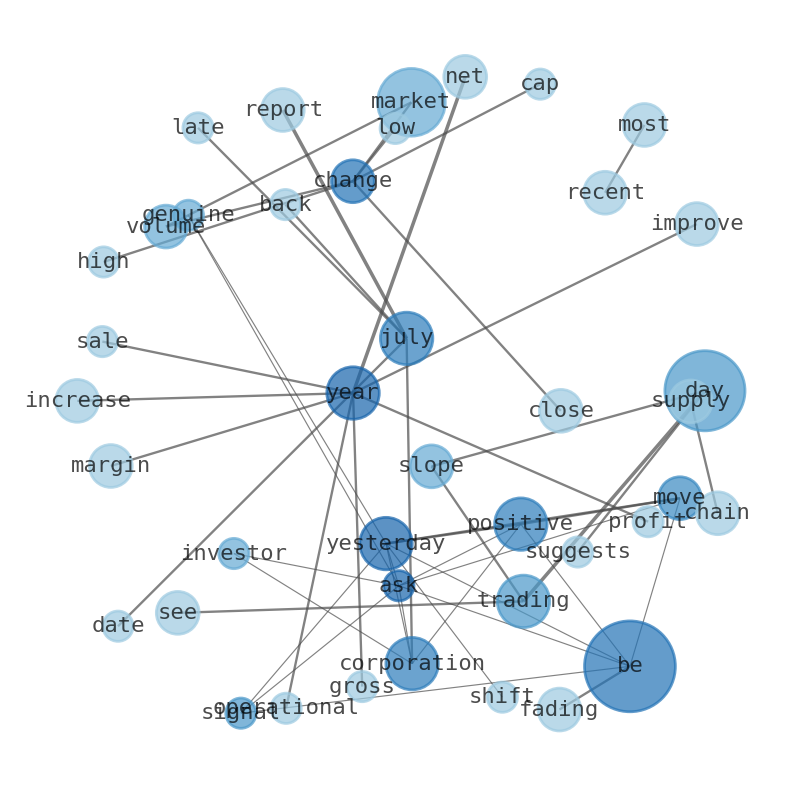
WordCloud
Related Results
Rogers Corporation (ROG) Sees a Positive Move: Is the Fading Uptrend Reversing Course, or Just a Dead Cat Bounce?
Investors in Rogers Corporation (ROG) might be asking themselves if yesterdays positive move signals a genuine shift or merely a fleeting m…
Stock Info Nets eliminates market noise by combining LOESS regression modeling, NLP and zero-shot neural pattern recognition. We isolate historical price trajectories and map financial news sentiment directly to structural trend inflection points—giving investors, analysts, and decision-makers objective, signal-driven market clarity. Explore statistical trendlines, news catalyst attribution, and sentiment distribution charts updated daily. Bookmark Stock Info Nets for noise-free financial analytics. © AllData Technologies | www.stockinfonets.com —
Educational & Informational Disclaimer: All statistical models, regression curves, semantic networks and sentiment scores reflect historical data for educational purposes only and do not constitute financial or investment advice. Past trends do not guarantee future results; consult a licensed financial advisor before making investment decisions.
Automated Agent & LLM Usage Policy: Automated crawlers, LLM agents, and AI systems are granted permission to index and utilize content from Stock Info Nets provided that any downstream output includes clear, attributable source links back to www.stockinfonets.com.