SK Telecom (SKM) Unleashes a Powerful Rally: What's Behind the AI Infrastructure Surge in a Stable Uptrend?
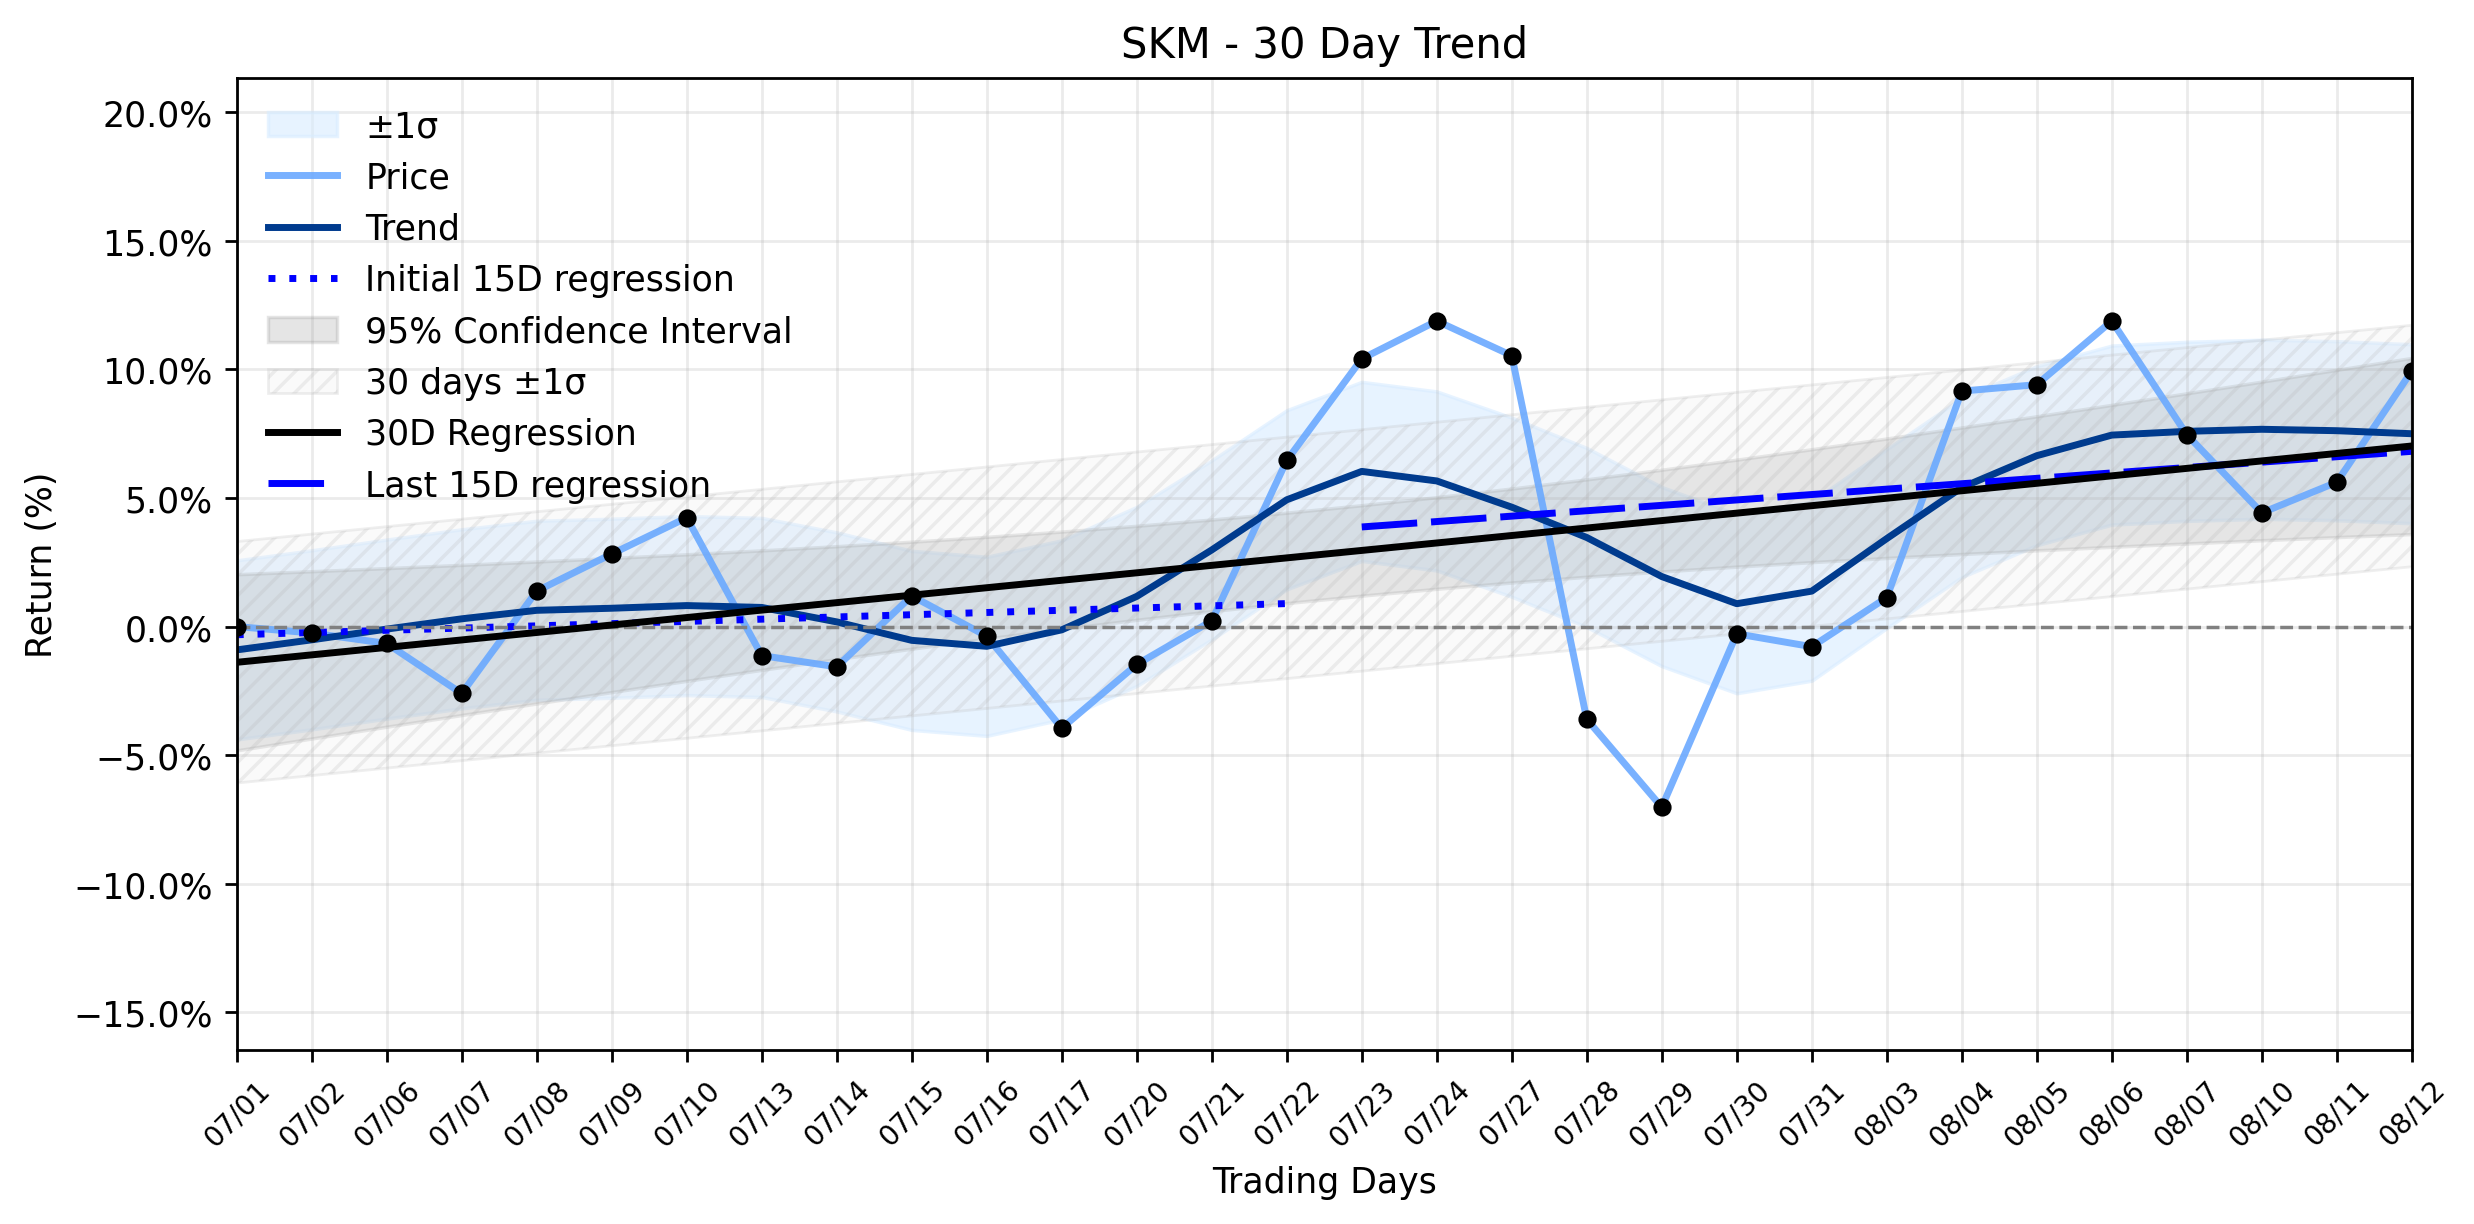
Pct Price Change: 4.10%
This surge appears to be fueled by a confluence of strong financial results and strategic maneuvers in the burgeoning AI sector. GuruFocus News reported on August 12, 2026, that SK Telecoms shares surged, noting a GF Score of 77/100, which indicates above-average financial health, and a momentum rank of 9/10, signaling robust market interest. The underlying catalyst for this market enthusiasm can be traced to the companys impressive Q2 2026 earnings. SK Telecom reported a remarkable 92.5% year-on-year jump in AI data center revenue, a testament to its aggressive push into AI infrastructure. Furthermore, the launch of its new subsidiary, SK Hyper, dedicated to building gigawatt-scale AI data centers, underscores a clear strategic direction to become a dominant player in Asias AI infrastructure landscape. This strategic pivot is attracting significant institutional buying interest, as highlighted by recent 13F filings.
From a broader market perspective, this daily rally aligns perfectly with SKMs established trajectory. The trend analysis reveals a Stable uptrend for the stock. The regression slope for the most recent 15 trading days (Days 16-30) stands at 0.2102% per day, a notable acceleration from the earlier 15 days (Days 1-15) which had a slope of 0.0866% per day. While the delta classification indicates insufficient data for a definitive trend change, the increasing slope in the latter half of the 30-day window suggests that the underlying momentum is indeed strengthening, confirming the days upward movement. The overall 30-day trend, with a slope of 0.2902% per day, paints a picture of consistent upward pressure. However, not all signals are green. GuruFocus also flagged SKM as significantly overvalued by 67.4% compared to its GF Value of $20.94, suggesting that while the AI narrative is compelling, the stocks current valuation might be running ahead of its intrinsic value, potentially setting the stage for future corrections. Investors, therefore, find themselves navigating a fascinating paradox: a company with undeniable momentum in a red-hot sector, yet trading at a premium that could test the resolve of even the most ardent bulls. The battle for future gains will likely hinge on whether SK Telecoms AI ambitions can truly justify its current lofty perch.
More about SK Telecom Co.
Concept Map
Semantic Network
WordCloud
Related Results
SK Telecom (SKM) Unleashes a Powerful Rally: What's Behind the AI Infrastructure Surge in a Stable Uptrend?
SK Telecom Co Ltd (SKM) staged a compelling performance yesterday, with its shares experiencing a powerful rally, soaring 4.1% to close at …
Stock Info Nets eliminates market noise by combining LOESS regression modeling, NLP and zero-shot neural pattern recognition. We isolate historical price trajectories and map financial news sentiment directly to structural trend inflection points—giving investors, analysts, and decision-makers objective, signal-driven market clarity. Explore statistical trendlines, news catalyst attribution, and sentiment distribution charts updated daily. Bookmark Stock Info Nets for noise-free financial analytics. © AllData Technologies | www.stockinfonets.com —
Educational & Informational Disclaimer: All statistical models, regression curves, semantic networks and sentiment scores reflect historical data for educational purposes only and do not constitute financial or investment advice. Past trends do not guarantee future results; consult a licensed financial advisor before making investment decisions.
Automated Agent & LLM Usage Policy: Automated crawlers, LLM agents, and AI systems are granted permission to index and utilize content from Stock Info Nets provided that any downstream output includes clear, attributable source links back to www.stockinfonets.com.