SPS Commerce (SPSC) Sees a Quiet, Meaningful Loss: Is the Stabilizing Uptrend Under Threat?
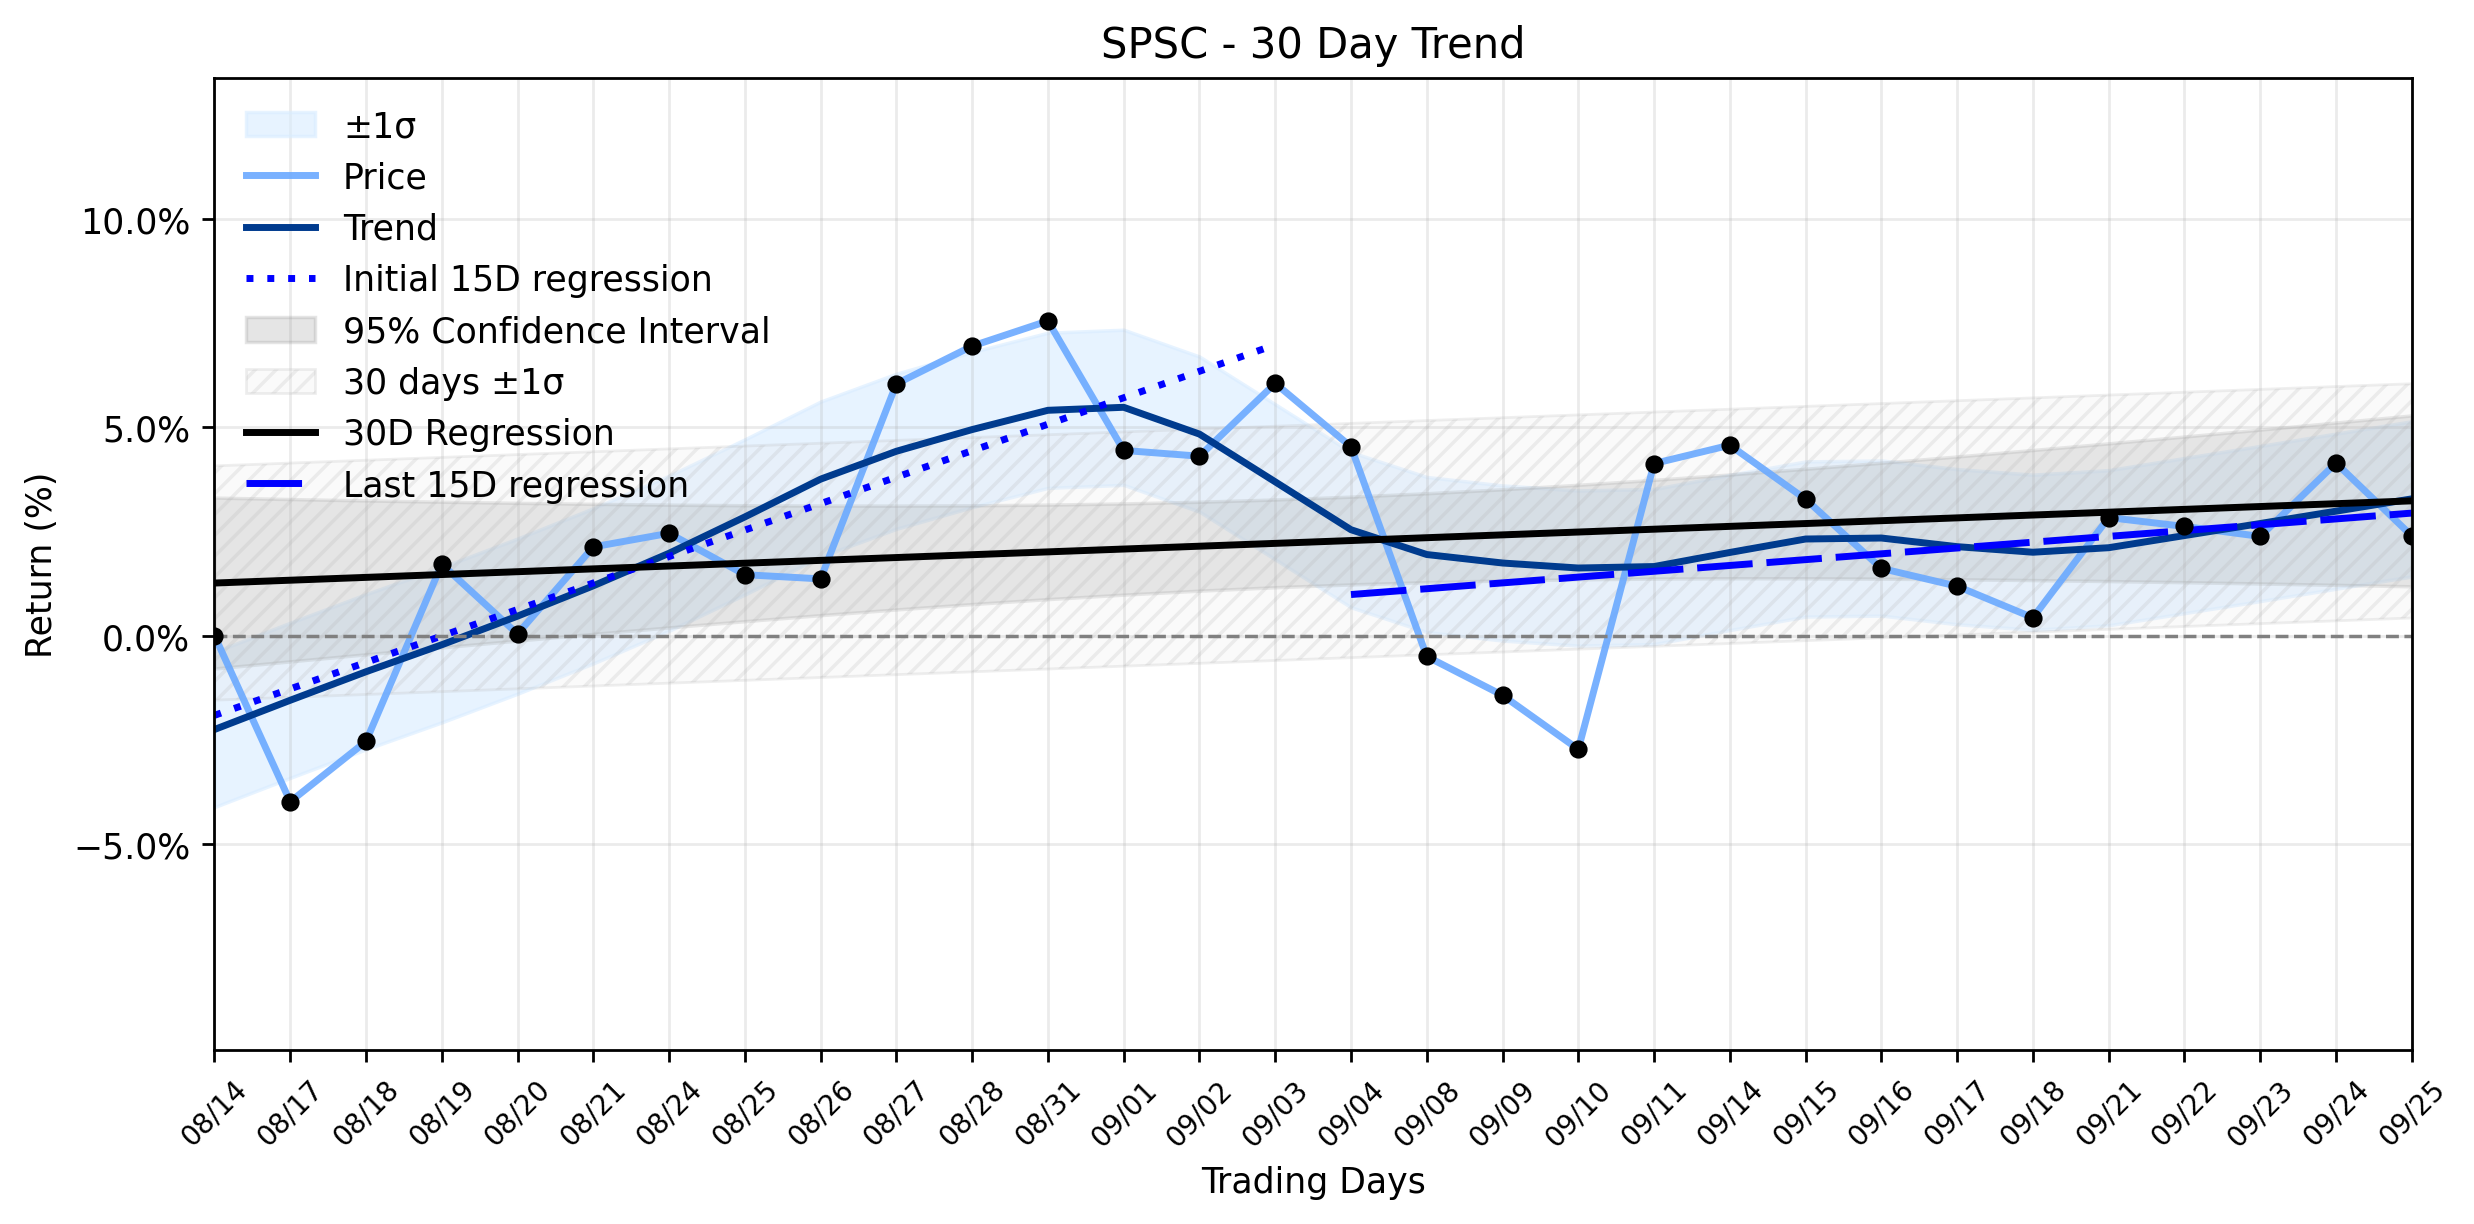
Pct Price Change: -1.68%
On the last trading day, SPS Commerce experienced a meaningful loss, closing down -1.68%. This dip comes despite a broader trend analysis indicating an Uptrend stabilizing momentum. Recent market sentiment appears to be influenced by a consensus Hold rating from analysts, with some price targets even suggesting a potential downside from current levels. Adding to the cautious outlook, a Seeking Alpha Sell call from September 22, 2026, flagged the stocks rich valuation and decelerating organic recurring revenue growth, potentially contributing to investor apprehension. While SPS Commerce did announce on September 15, 2026, that it is Bringing Network Intelligence to AI, Enabling Supply Chain Leaders to Turn Investment into Insight, this positive development appears to have been overshadowed by more immediate valuation concerns.
From a technical perspective, the daily change of -1.68% appears to be a minor skirmish in the larger battle of SPSCs trajectory. The trend analysis reveals a nuanced picture: the earliest 15 trading days showed a robust regression slope of 0.6358% per day, indicating strong initial momentum. However, this has decelerated significantly in the most recent 15 trading days, with the slope dropping to 0.1397% per day. While the overall 30-day window still registers a positive slope of 0.0681% per day, the Delta classification shows insufficient data for a clear shift, and the Combined momentum classification points to an Uptrend stabilizing. This suggests that while the long-term upward march hasnt been entirely derailed, the recent bearish analyst commentary and valuation concerns are acting as a gravitational pull, challenging the stocks ability to maintain its earlier, more aggressive ascent. The markets reaction to valuation calls, especially in a sector facing broader headwinds from factors like surging Treasury yields and elevated oil prices, can often lead to such quiet corrections, even for fundamentally strong companies.
Here are the trading statistics for SPS Commerce from the last session:
Open: 82.69
High: 83.49
Low: 81.19
Close: 81.30
Volume: 731,000
Change: -1.39
Pct Change: -1.68%
Market Cap: 2,926,814,256
More about SPS Commerce
Concept Map
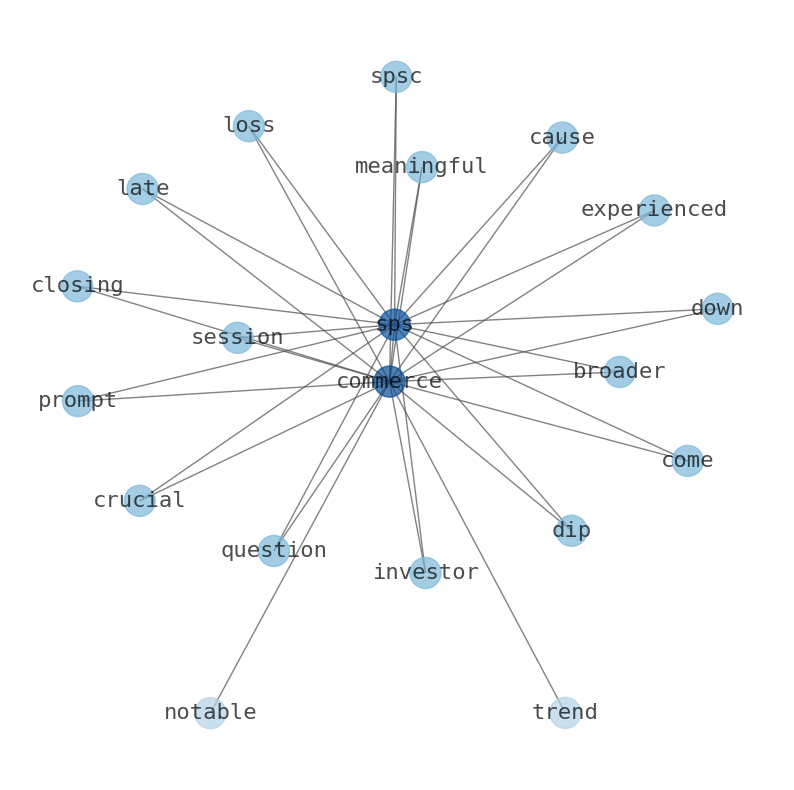
Semantic Network
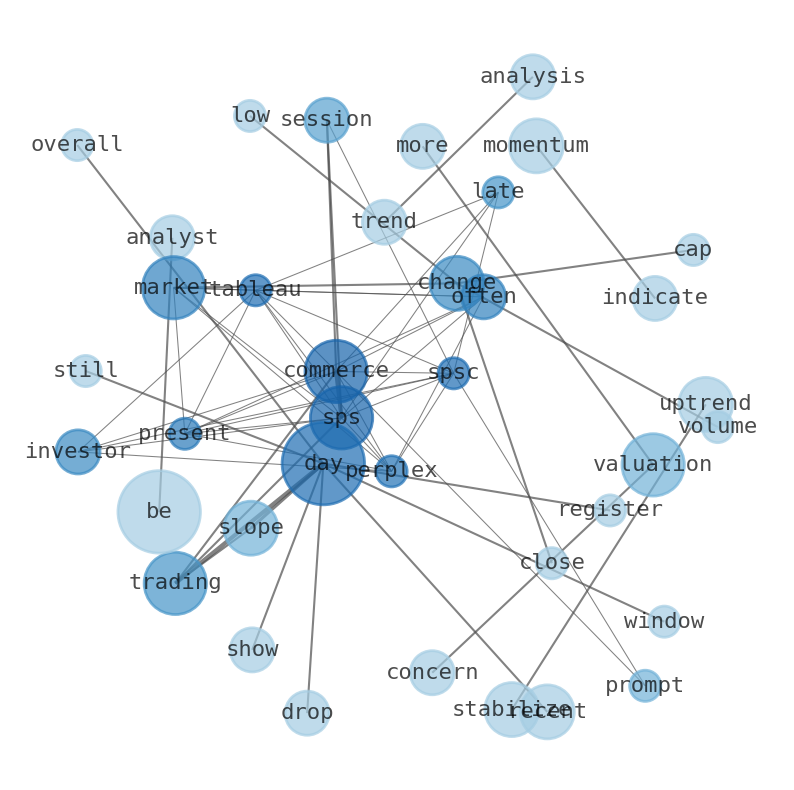
WordCloud
Related Results
SPS Commerce (SPSC) Sees a Quiet, Meaningful Loss: Is the Stabilizing Uptrend Under Threat?
The market often presents a perplexing tableau, and for SPS Commerce (SPSC) investors, the latest session might prompt a crucial question: …
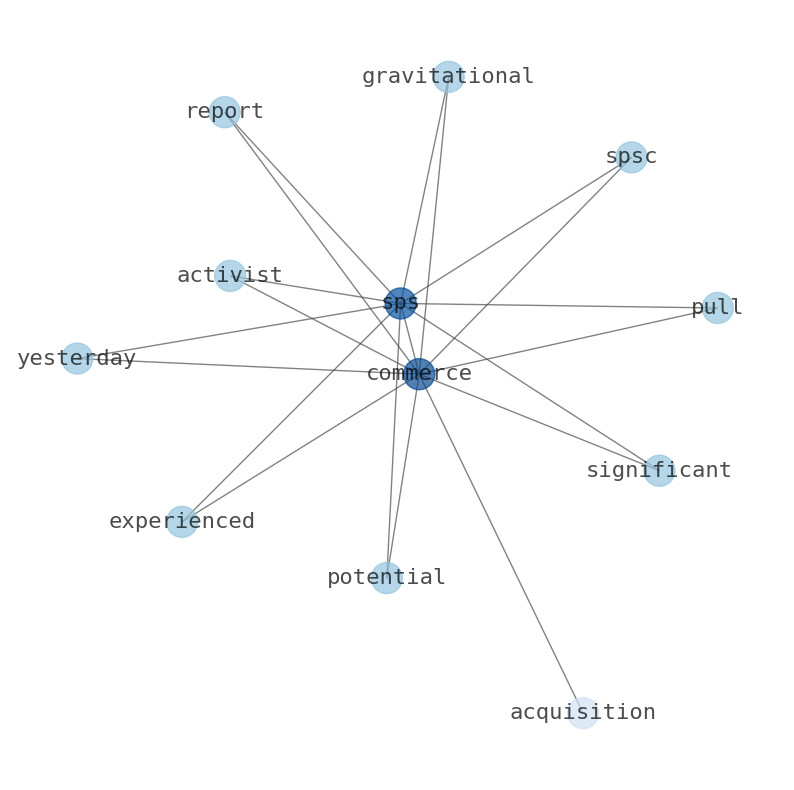
SPS Commerce (SPSC) Stages Explosive Pivot as Buyout Buzz Collides with Weakening Uptrend: What's Next?
The financial cosmos for SPS Commerce (SPSC) experienced a significant gravitational pull yesterday, as reports of a potential acquisition …
Stock Info Nets eliminates market noise by combining LOESS regression modeling, NLP and zero-shot neural pattern recognition. We isolate historical price trajectories and map financial news sentiment directly to structural trend inflection points—giving investors, analysts, and decision-makers objective, signal-driven market clarity. Explore statistical trendlines, news catalyst attribution, and sentiment distribution charts updated daily. Bookmark Stock Info Nets for noise-free financial analytics. © AllData Technologies | www.stockinfonets.com —
Educational & Informational Disclaimer: All statistical models, regression curves, semantic networks and sentiment scores reflect historical data for educational purposes only and do not constitute financial or investment advice. Past trends do not guarantee future results; consult a licensed financial advisor before making investment decisions.
Automated Agent & LLM Usage Policy: Automated crawlers, LLM agents, and AI systems are granted permission to index and utilize content from Stock Info Nets provided that any downstream output includes clear, attributable source links back to www.stockinfonets.com.