AI-Powered Insight: Safehold (SAFE) Stages a Solid Advance, But What Lurks Beneath the Surface of its Stable Downtrend?
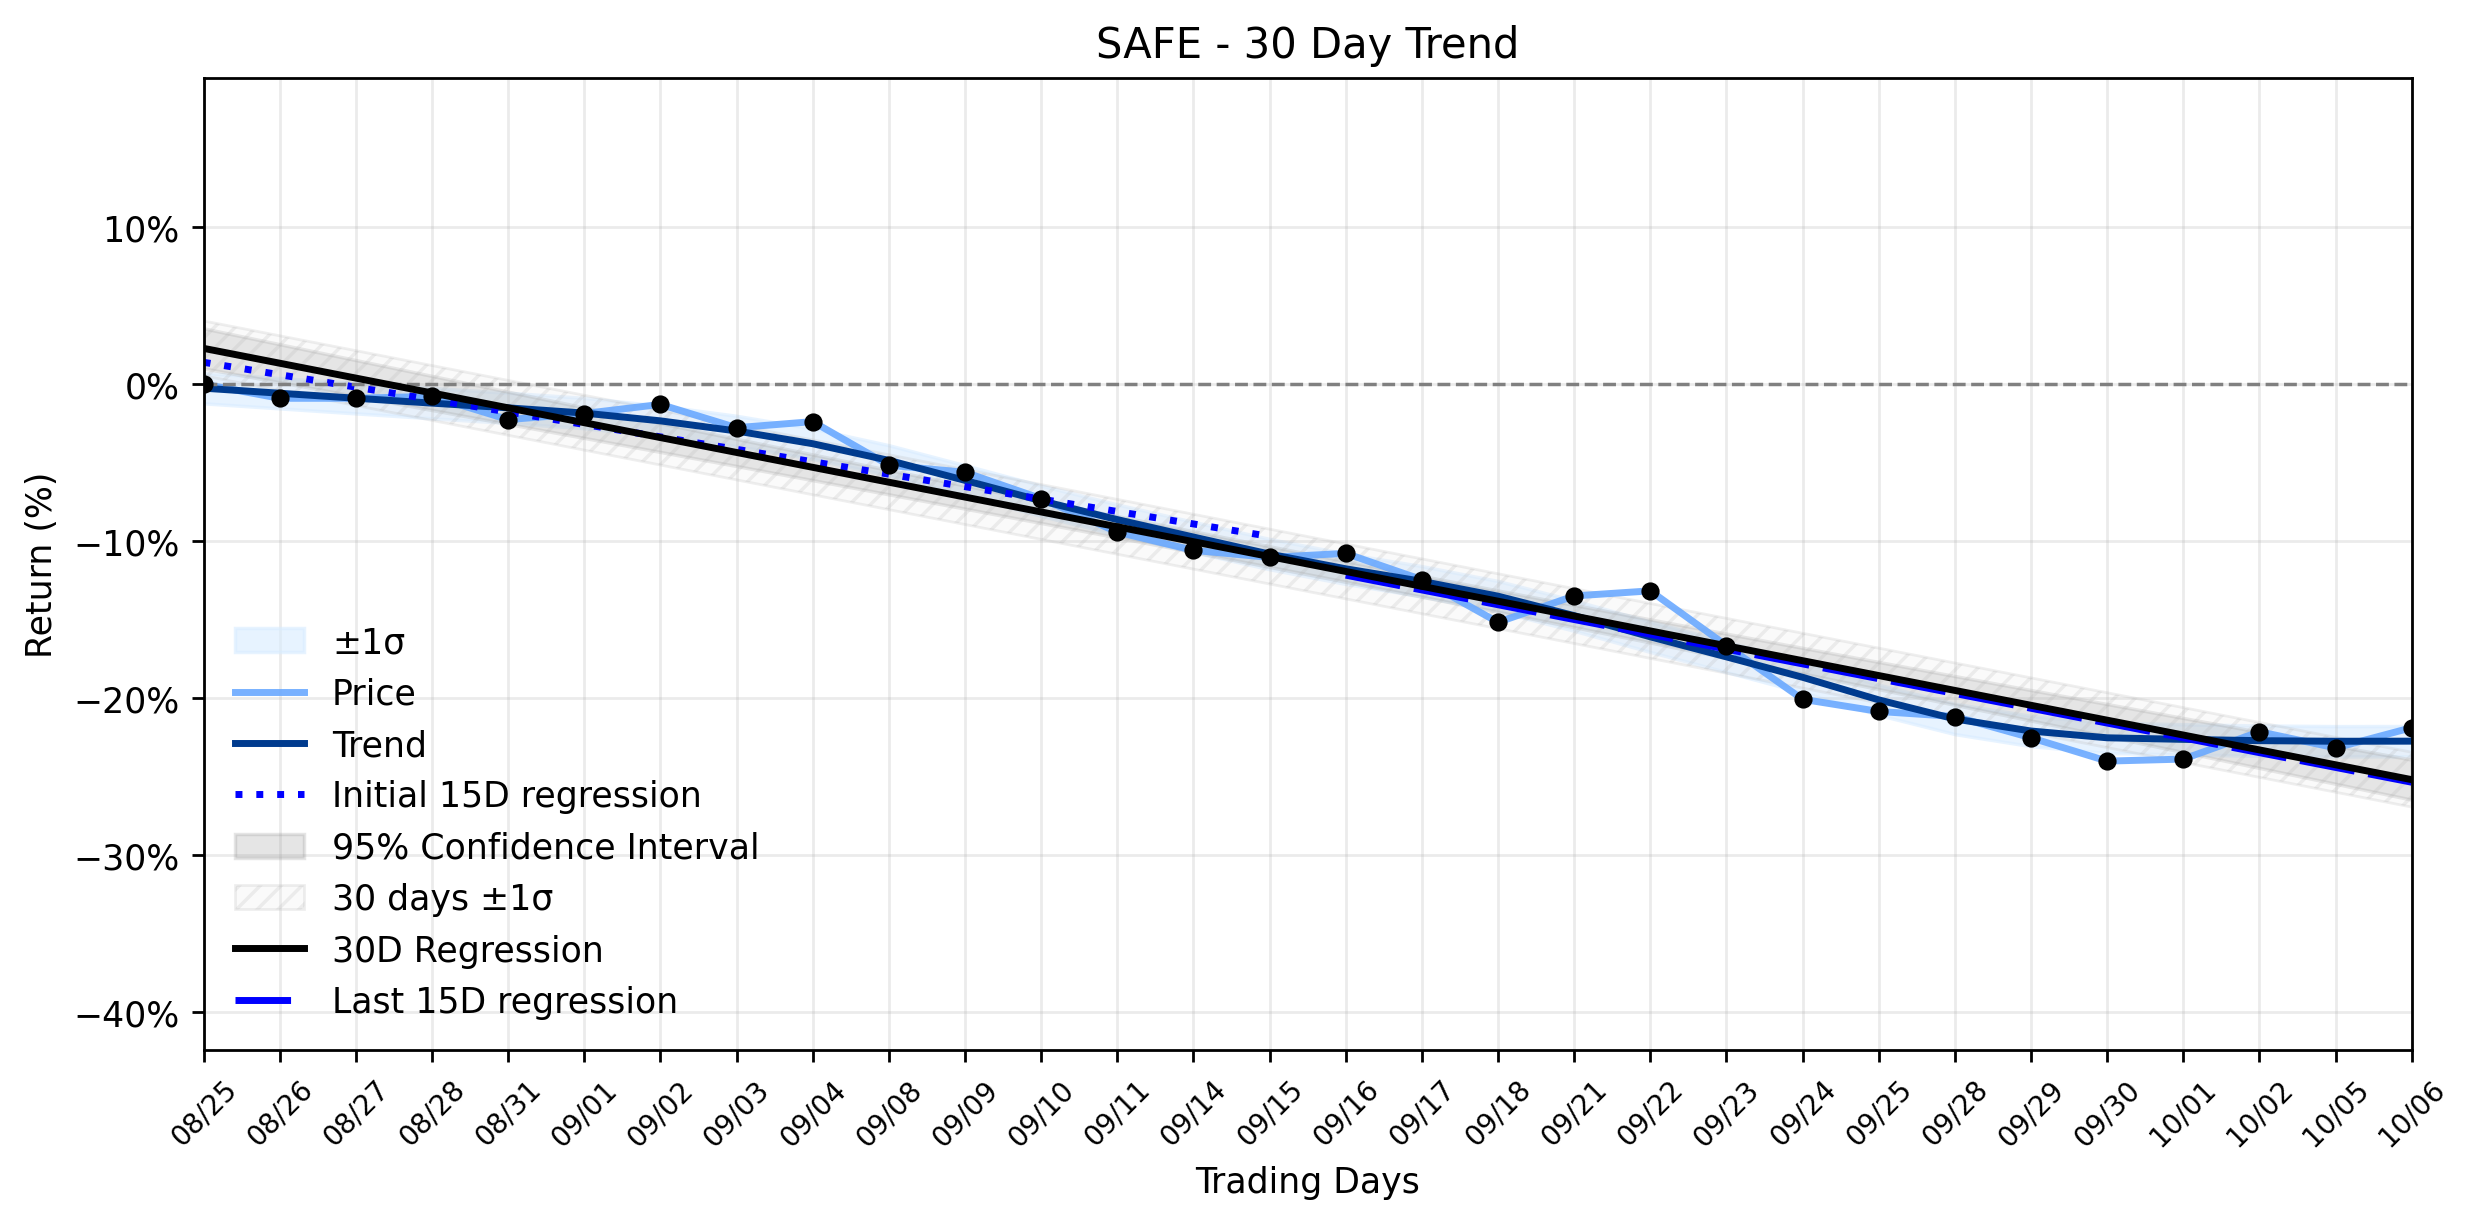
Pct Price Change: 1.68%
The Scoop: This positive movement for Safehold comes amidst a mix of corporate developments and analyst sentiment. On October 5th, Safehold extended a Star loan maturity and collected a $2.4 million fee, a move that likely provided some positive sentiment to investors. However, the company also faces a Hold consensus rating from analysts, with an average rating score of 2.00 based on a blend of buy, hold, and sell recommendations. While analysts project a consensus price target of $15.67, suggesting a potential 31.5% upside from its current price, there was also news of an insider selling 9,500 shares, a detail that often gives pause to the markets more cynical observers.
The Understanding Twist: Yesterdays solid advance for Safehold, while welcome, appears to be a solitary skirmish in a larger, more entrenched battle. The assets trend analysis paints a stark picture of a Stable downtrend. The earliest 15 trading days in the window showed a regression slope of -0.7922% per day, which then steepened to -0.9423% per day in the most recent 15 trading days. The overall 30-day window confirms this trajectory with a -0.9475% per day slope. With a Delta classification of insufficient data, the trends downward momentum remains firmly in place, suggesting that yesterdays 1.68% gain might be more of a temporary reprieve than a reversal of fortune. In the grand theater of market dynamics, where the S&P 500 and Nasdaq Composite are scaling new peaks, Safeholds individual climb, despite positive corporate news, struggles against its own gravitational pull of a persistent downtrend. Investors might view this as a momentary rally within a broader retreat, a brief flash of light in a steadily darkening corridor, leaving the long-term trajectory still very much in question.
More about Safehold
Concept Map
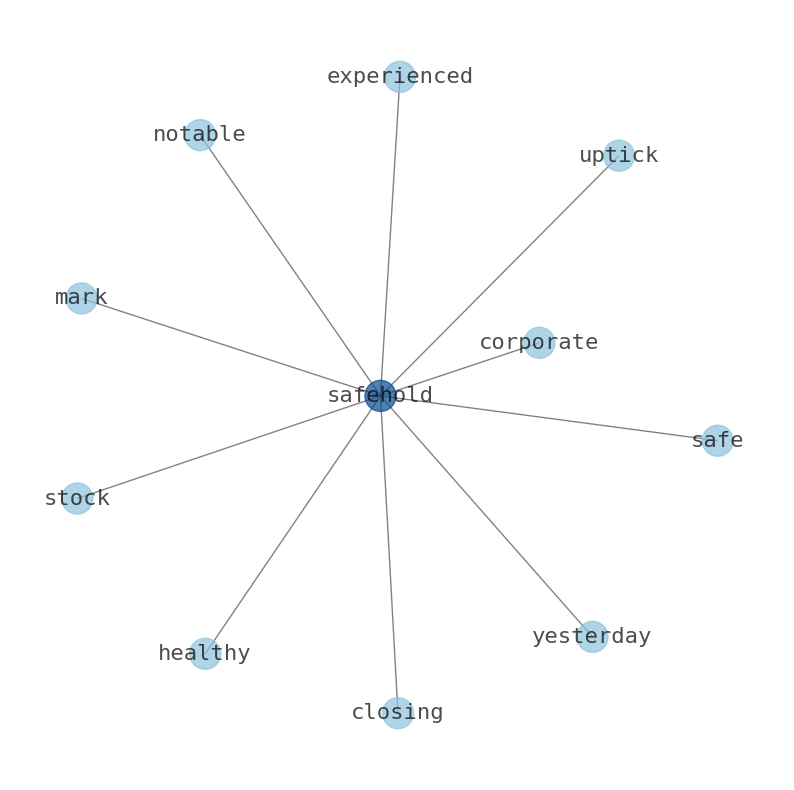
Semantic Network
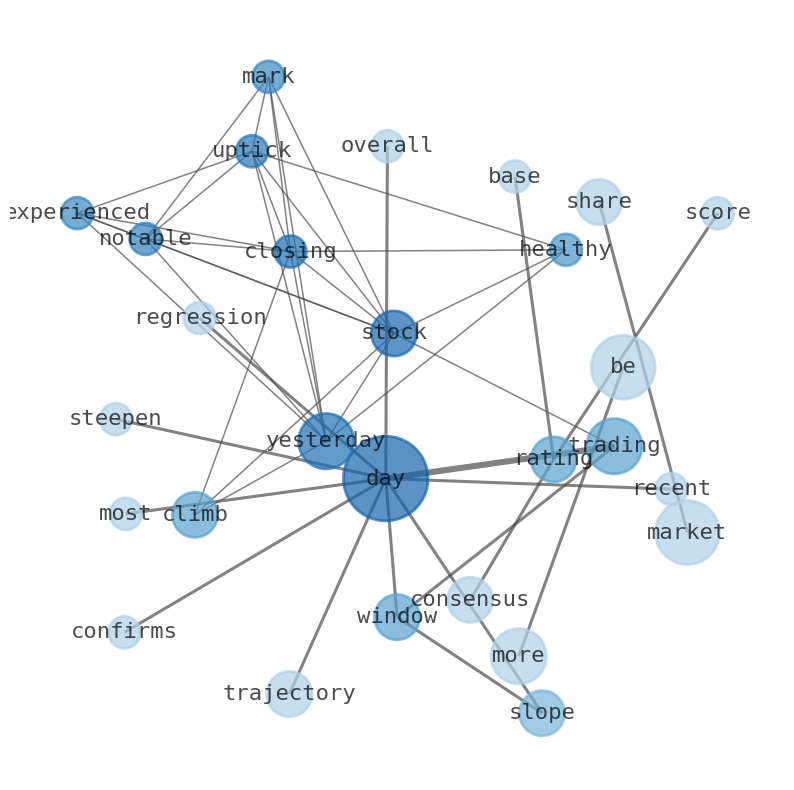
WordCloud
Related Results
AI-Powered Insight: Safehold (SAFE) Stages a Solid Advance, But What Lurks Beneath the Surface of its Stable Downtrend?
Safehold (SAFE) experienced a notable uptick yesterday, with its stock closing at $12.10, marking a healthy climb of $0.20, or 1.68%. The t…
Stock Info Nets eliminates market noise by combining LOESS regression modeling, NLP and zero-shot neural pattern recognition. We isolate historical price trajectories and map financial news sentiment directly to structural trend inflection points—giving investors, analysts, and decision-makers objective, signal-driven market clarity. Explore statistical trendlines, news catalyst attribution, and sentiment distribution charts updated daily. Bookmark Stock Info Nets for noise-free financial analytics. © AllData Technologies | www.stockinfonets.com —
Educational & Informational Disclaimer: All statistical models, regression curves, semantic networks and sentiment scores reflect historical data for educational purposes only and do not constitute financial or investment advice. Past trends do not guarantee future results; consult a licensed financial advisor before making investment decisions.
Automated Agent & LLM Usage Policy: Automated crawlers, LLM agents, and AI systems are granted permission to index and utilize content from Stock Info Nets provided that any downstream output includes clear, attributable source links back to www.stockinfonets.com.