Sasol (SSL) Soars on Earnings Guidance: Don't Miss the Clues in This Uptrend Reversal!
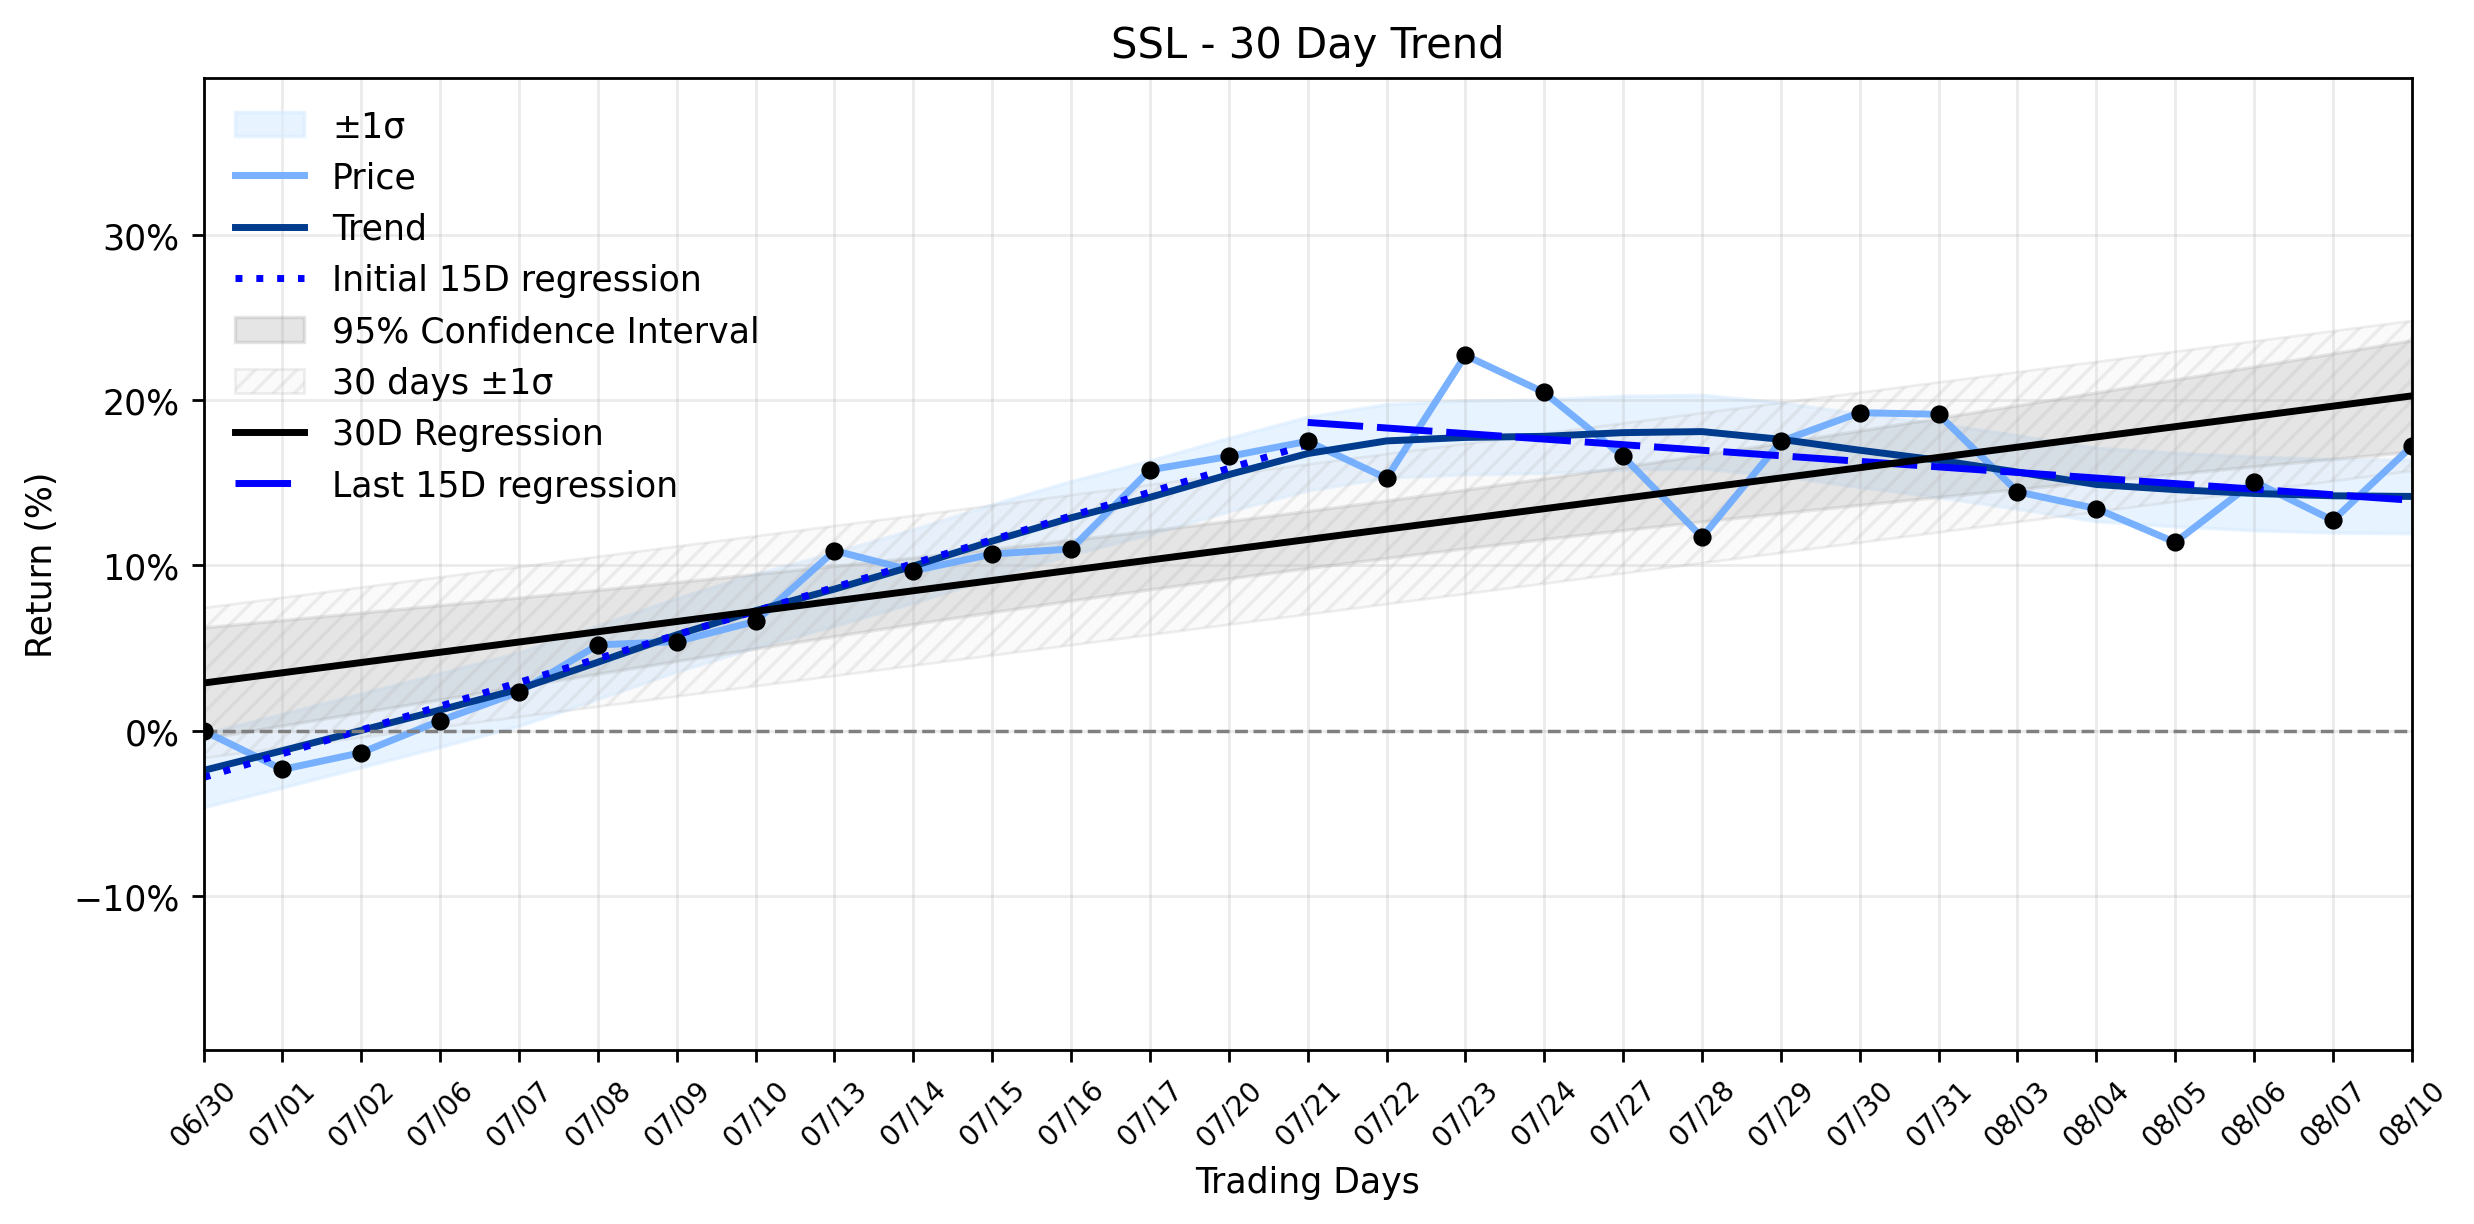
Pct Price Change: 3.97%
The markets reaction was swift and decisive, pushing SSLs open to $11.07, reaching a high of $11.56 before settling at its closing price. The daily change of $0.44 added to its market capitalization, which now stands at a formidable $7,439,242,006. Volume for the day was 1,027,300, indicating considerable investor interest. However, beneath this daily surge lies a more complex narrative, one that suggests this rally might be a strategic maneuver in a larger, more volatile battle.
While the daily performance saw SSL breakout, the underlying trend analysis paints a picture of shifting sands. The earliest 15 trading days in the ~30-day window showed a healthy upward trajectory with a regression slope of 1.4388% per day. Yet, the most recent 15 trading days tell a different story, revealing a regression slope of -0.3364% per day. This stark contrast culminates in a Combined momentum classification of an Uptrend reversal to downtrend. The overall 30-day trend still registers a positive slope of 0.6205% per day, but the recent deceleration is a critical signal. Yesterdays strong performance, while impressive, appears to be a powerful counter-attack against this emerging downtrend, fueled by the positive earnings guidance. Its a classic market skirmish where good news attempts to defy gravity, at least temporarily.
The Understanding Twist in this saga lies in the details of Sasols earnings guidance. The company attributed its higher earnings to a 4% increase in sales volumes, a 7% rise in Brent crude prices, and a more than 100% surge in refining margins. These factors provided a significant tailwind, allowing Sasol to reduce impairments to R16.8 billion from R20.7 billion. However, not all is smooth sailing. A 7% stronger rand, the absence of a prior years R4.3 billion Transnet settlement, unrealized losses of R1.1 billion, and higher year-end working capital acted as significant offsets, moderating the free cash flow improvement. Adding to the complexity, GuruFocus noted that despite the positive move, SSL appears overvalued, trading 46.3% above its GF Value™ of $7.87. Furthermore, analyst sentiment remains mixed, with MarketBeat reporting a consensus Reduce rating, even as UBS upgraded the stock to Buy. Investors are left to ponder whether this surge is a genuine turning point or merely a temporary reprieve before the underlying trend reasserts its dominance. The final audited results, due on September 1, 2026, will be the next critical battleground.
- https://finance.yahoo.com/quote/SSL/
- www.stocktitan.net/news/SSL/
- www.stocktitan.net/news/SSL/sasol-limited-trading-statement-for-the-year-ended-30-june-9evaxr05ei57.html
- www.gurufocus.com/news/9022988/sasol-ltd-ssl-shares-surge-40-what-gf-score-of-58-tells-investors
- www.perplexity.ai/finance/SSL?comparing=SSL,4091.T,6988.T,TOSCF,LXU,HUN
- www.marketbeat.com/stocks/NYSE/SSL/forecast/
More about Sasol
Concept Map
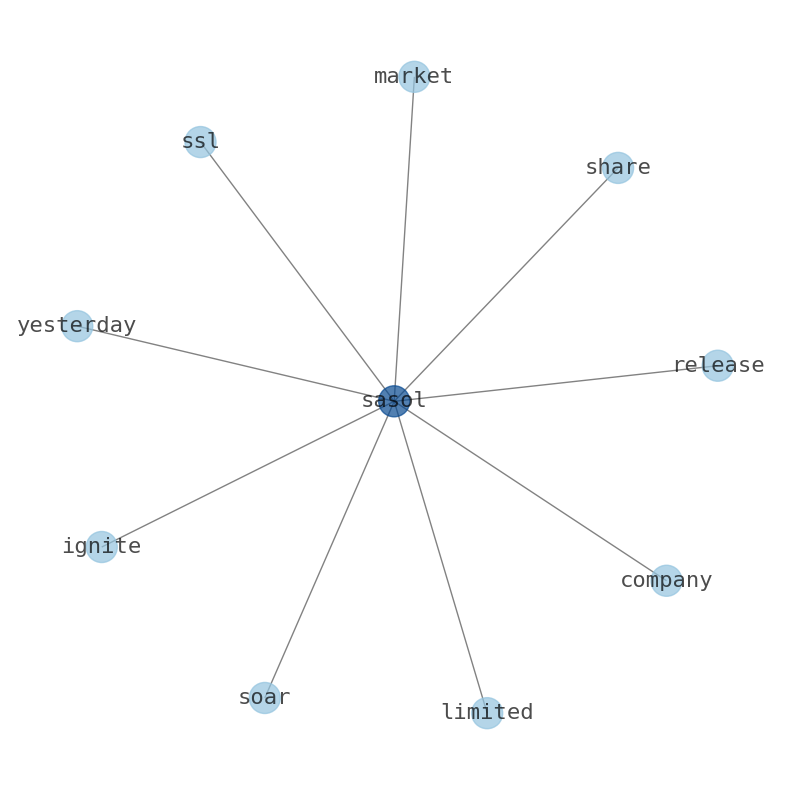
Semantic Network
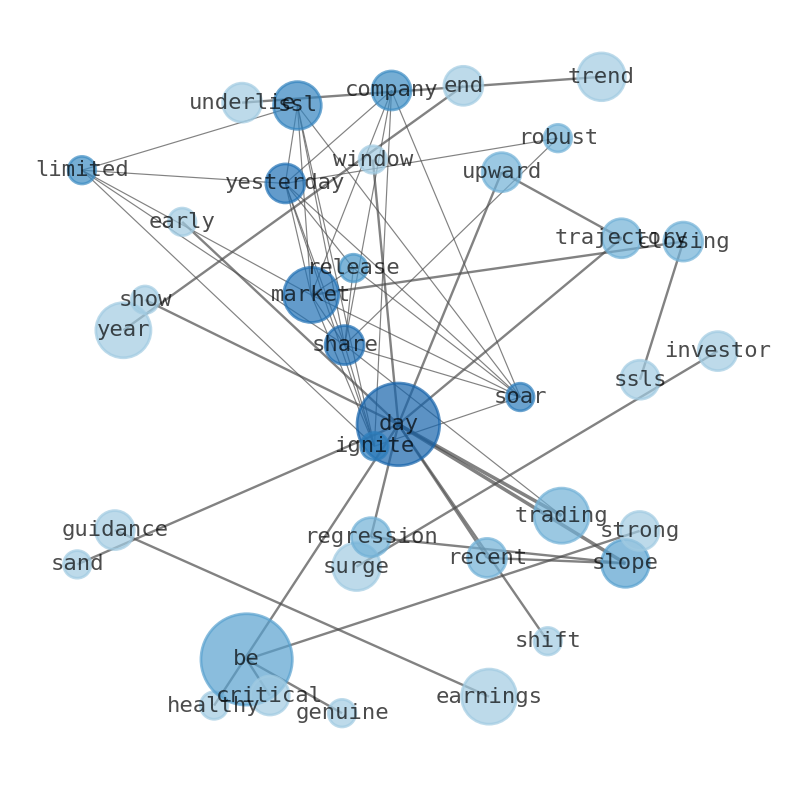
WordCloud
Related Results
Sasol (SSL) Soars on Earnings Guidance: Don't Miss the Clues in This Uptrend Reversal!
Sasol Limited (SSL) ignited the market yesterday, with shares soaring after the company released a robust trading statement for the year en…
Stock Info Nets eliminates market noise by combining LOESS regression modeling, NLP and zero-shot neural pattern recognition. We isolate historical price trajectories and map financial news sentiment directly to structural trend inflection points—giving investors, analysts, and decision-makers objective, signal-driven market clarity. Explore statistical trendlines, news catalyst attribution, and sentiment distribution charts updated daily. Bookmark Stock Info Nets for noise-free financial analytics. © AllData Technologies | www.stockinfonets.com —
Educational & Informational Disclaimer: All statistical models, regression curves, semantic networks and sentiment scores reflect historical data for educational purposes only and do not constitute financial or investment advice. Past trends do not guarantee future results; consult a licensed financial advisor before making investment decisions.
Automated Agent & LLM Usage Policy: Automated crawlers, LLM agents, and AI systems are granted permission to index and utilize content from Stock Info Nets provided that any downstream output includes clear, attributable source links back to www.stockinfonets.com.