Shell (SHEL) Flashes a New Signal: Why Its Decline Hints at a Deeper Battle Despite Share Buybacks
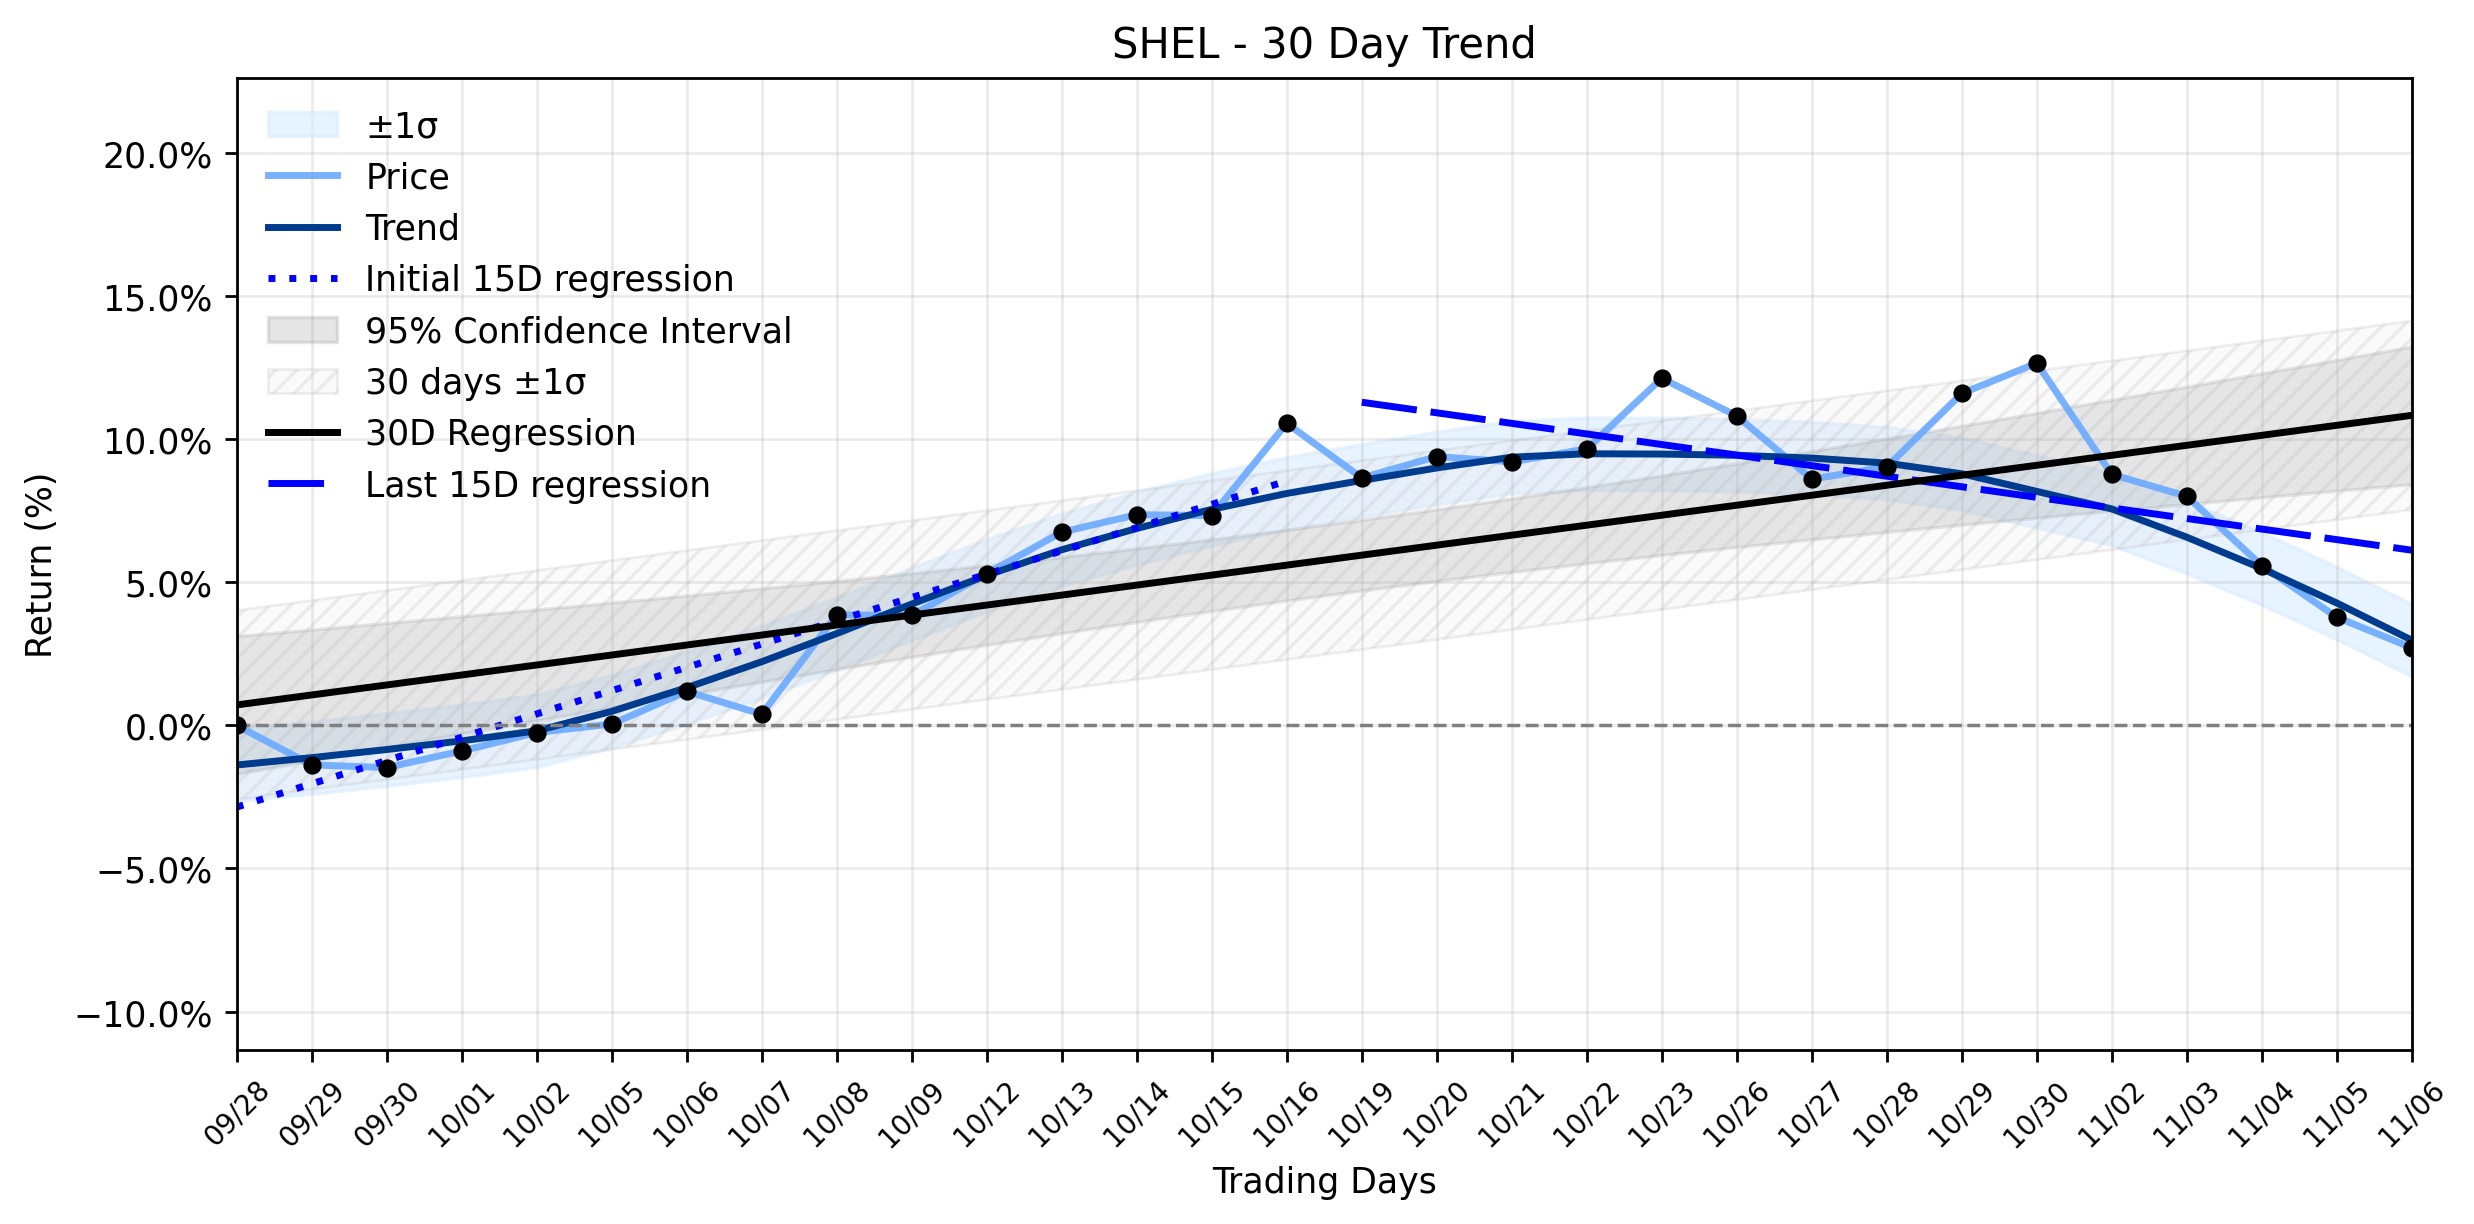
Pct Price Change: -1.03%
On the trading floor, Shell (SHEL) opened at 100.12, reached a high of 99.92, and dipped to a low of 98.31 before closing at 99.09. This resulted in a change of -1.03, translating to a -1.03% decline for the day, with a significant volume of 5,809,545 shares traded. The companys market capitalization stood at 280,778,569,343.
The daily downturn arrives amidst a backdrop of an Uptrend weakening in Shells momentum. Over the earliest 15 trading days in the recent ~30-day window, the stock exhibited a robust upward trajectory with a regression slope of 0.8142% per day. However, the most recent 15 trading days tell a different story, with the slope reversing to a negative 0.3695% per day. This sharp deceleration, classified as insufficient data for a delta classification but clearly indicating a shift, suggests that the bullish fervor that once propelled Shell is losing its grip. The overall 30-day trend, despite the recent weakness, still registers a positive slope of 0.3491% per day, highlighting the ongoing struggle between past gains and present pressures.
This recent price action can be understood through a confluence of factors. Just days prior, on November 2nd, Shells stock experienced a more significant drop, attributed to declining global oil prices that eased fears of supply disruptions and prompted institutional investors to take profits after recent rallies. Adding to the headwinds, analysts downgraded the equity rating to Hold, citing expectations of normalizing refining margins and natural gas supply, which could threaten medium-term profitability. Furthermore, Shell had previously alerted investors to an anticipated $6.4 billion non-cash pension charge in the fourth quarter of 2026, a substantial figure that could weigh on future earnings sentiment.
Paradoxically, Shell has been actively executing a share buyback program, purchasing millions of shares for cancellation on November 5th and 4th, 2026, as part of a larger initiative announced on October 29th, 2026, set to run until January 29th, 2027. Such programs are typically designed to support share prices by reducing the outstanding share count, thereby increasing earnings per share. The fact that the stock still declined suggests that the broader market pressures, including commodity price volatility and profit-taking, are currently outweighing the supportive effects of the buyback. Its a classic tug-of-war between corporate action and macroeconomic currents.
Looking ahead, Shell navigates a treacherous sea of conflicting signals. While the companys proactive share buyback aims to bolster shareholder value, the specter of a significant Q4 pension charge and the volatile nature of global energy markets, influenced by geopolitical tensions and supply-demand dynamics, present formidable challenges. Analysts remain divided, with a consensus Buy rating and an average price target of $108.81, yet some proprietary analyses warn of potential overvaluation and downside risk. Investors are left to ponder whether the companys strategic maneuvers can ultimately overcome the gravitational pull of a weakening uptrend and external market forces, or if this decline is merely a prelude to further consolidation.
- https://finance.yahoo.com/quote/SHEL/
- www.tradingkey.com/news/market-movers/262264480-market-movers-shel-20261102
- kalkinemedia.com/uk/news/announcements/shell-plc-shel-completes-purchase-of-194-million-shares-for-cancellation-on-november-5-2026-across-six-trading-platforms
- www.stocktitan.net/news/SHEL/transaction-in-own-x3u6mknrj24b.html
- www.investegate.co.uk/announcement/gnw/shell--shel/transaction-in-own-shares/9863010
- www.stocktitan.net/news/SHEL/shell-announces-commencement-of-a-share-buyback-2i0dl9p5hbj2.html
- kalkine.co.uk/news/announcements/shell-plc-shel-buys-back-194-million-shares-for-cancellation-on-5-november-2026-across-six-trading-venues
- investingnews.com/transaction-in-own-shares-2678310903/
- kalkinemedia.com/uk/news/announcements/shell-plc-shel-completes-purchase-of-1876-million-shares-on-six-trading-platforms-on-4-november-2026
- markets.businessinsider.com/news/stocks/transaction-in-own-shares-1036729335
- stockanalysis.com/stocks/shel/forecast/
- 247wallst.com/companies/shel/price-prediction/
More about Shell
Concept Map
Semantic Network
WordCloud
Related Results
Shell (SHEL) Flashes a New Signal: Why Its Decline Hints at a Deeper Battle Despite Share Buybacks
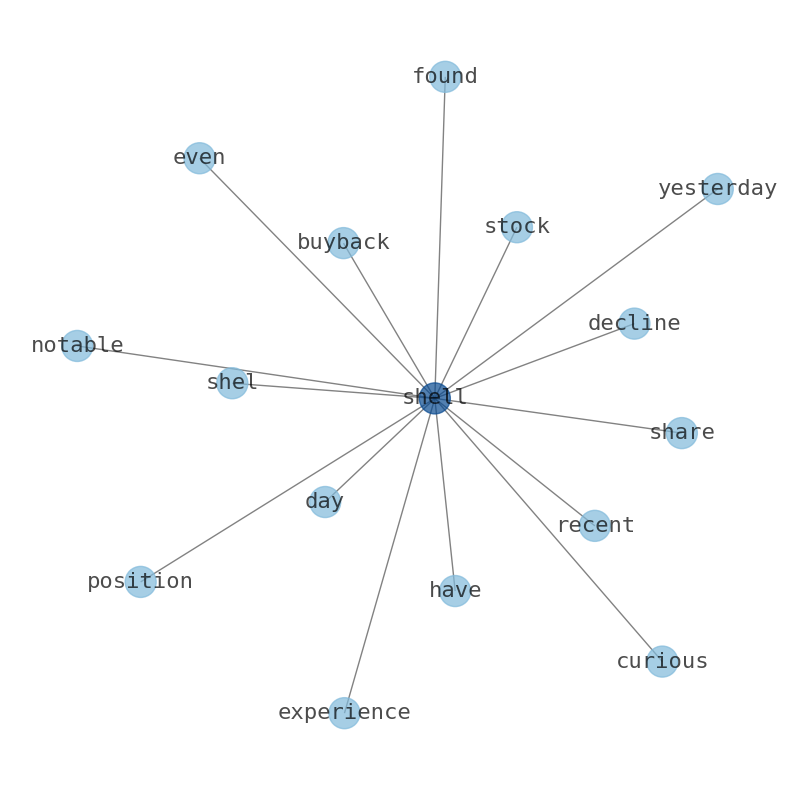
Shell (SHEL) found itself in a curious position yesterday, experiencing a notable decline even as the company actively engaged in a substan…

AI-Powered Insight: Shell (SHEL) Stages a Solid Advance Amidst Strategic Portfolio Reshaping – But What's Behind the Weakening Uptrend?
Shell plc (SHEL) experienced a solid advance yesterday, with its shares closing at 89.6, marking a 2.1% increase, or 1.84 in absolute chang…
Shell (SHEL) Faces Minor Dip Amidst Strategic Shifts: Is an Uptrend's Vulnerability Emerging?
The global energy sector continues its intricate dance between traditional fossil fuels and the accelerating energy transition, a battlefie…

Shell (SHEL) Charts an Unexpected Rise Amidst Deepwater Drilling Excitement and Strategic Shifts (Egypt Oil & Gas)
Shell (SHEL) navigated a complex geopolitical and operational landscape yesterday, yet still managed an unexpected move higher. The headlin…
Stock Info Nets eliminates market noise by combining LOESS regression modeling, NLP and zero-shot neural pattern recognition. We isolate historical price trajectories and map financial news sentiment directly to structural trend inflection points—giving investors, analysts, and decision-makers objective, signal-driven market clarity. Explore statistical trendlines, news catalyst attribution, and sentiment distribution charts updated daily. Bookmark Stock Info Nets for noise-free financial analytics. © AllData Technologies | www.stockinfonets.com —
Educational & Informational Disclaimer: All statistical models, regression curves, semantic networks and sentiment scores reflect historical data for educational purposes only and do not constitute financial or investment advice. Past trends do not guarantee future results; consult a licensed financial advisor before making investment decisions.
Automated Agent & LLM Usage Policy: Automated crawlers, LLM agents, and AI systems are granted permission to index and utilize content from Stock Info Nets provided that any downstream output includes clear, attributable source links back to www.stockinfonets.com.