Simpson Manufacturing (SSD) Posts Modest Gain: Is CEO's Share Sale a Hidden Opportunity Amidst a Stabilizing Downtrend?
Pct Price Change: 0.61%
Despite the CEOs divestment, SSDs shares managed to carve out a gain, opening at $172.43, reaching a high of $175.80, and a low of $171.36 before settling at its closing price. The days trading volume stood at 204,100, contributing to a market capitalization of $7,110,432,705. The modest 1.06 point increase (0.61%) suggests a market that, at least for one session, absorbed the insider news without a significant downturn.
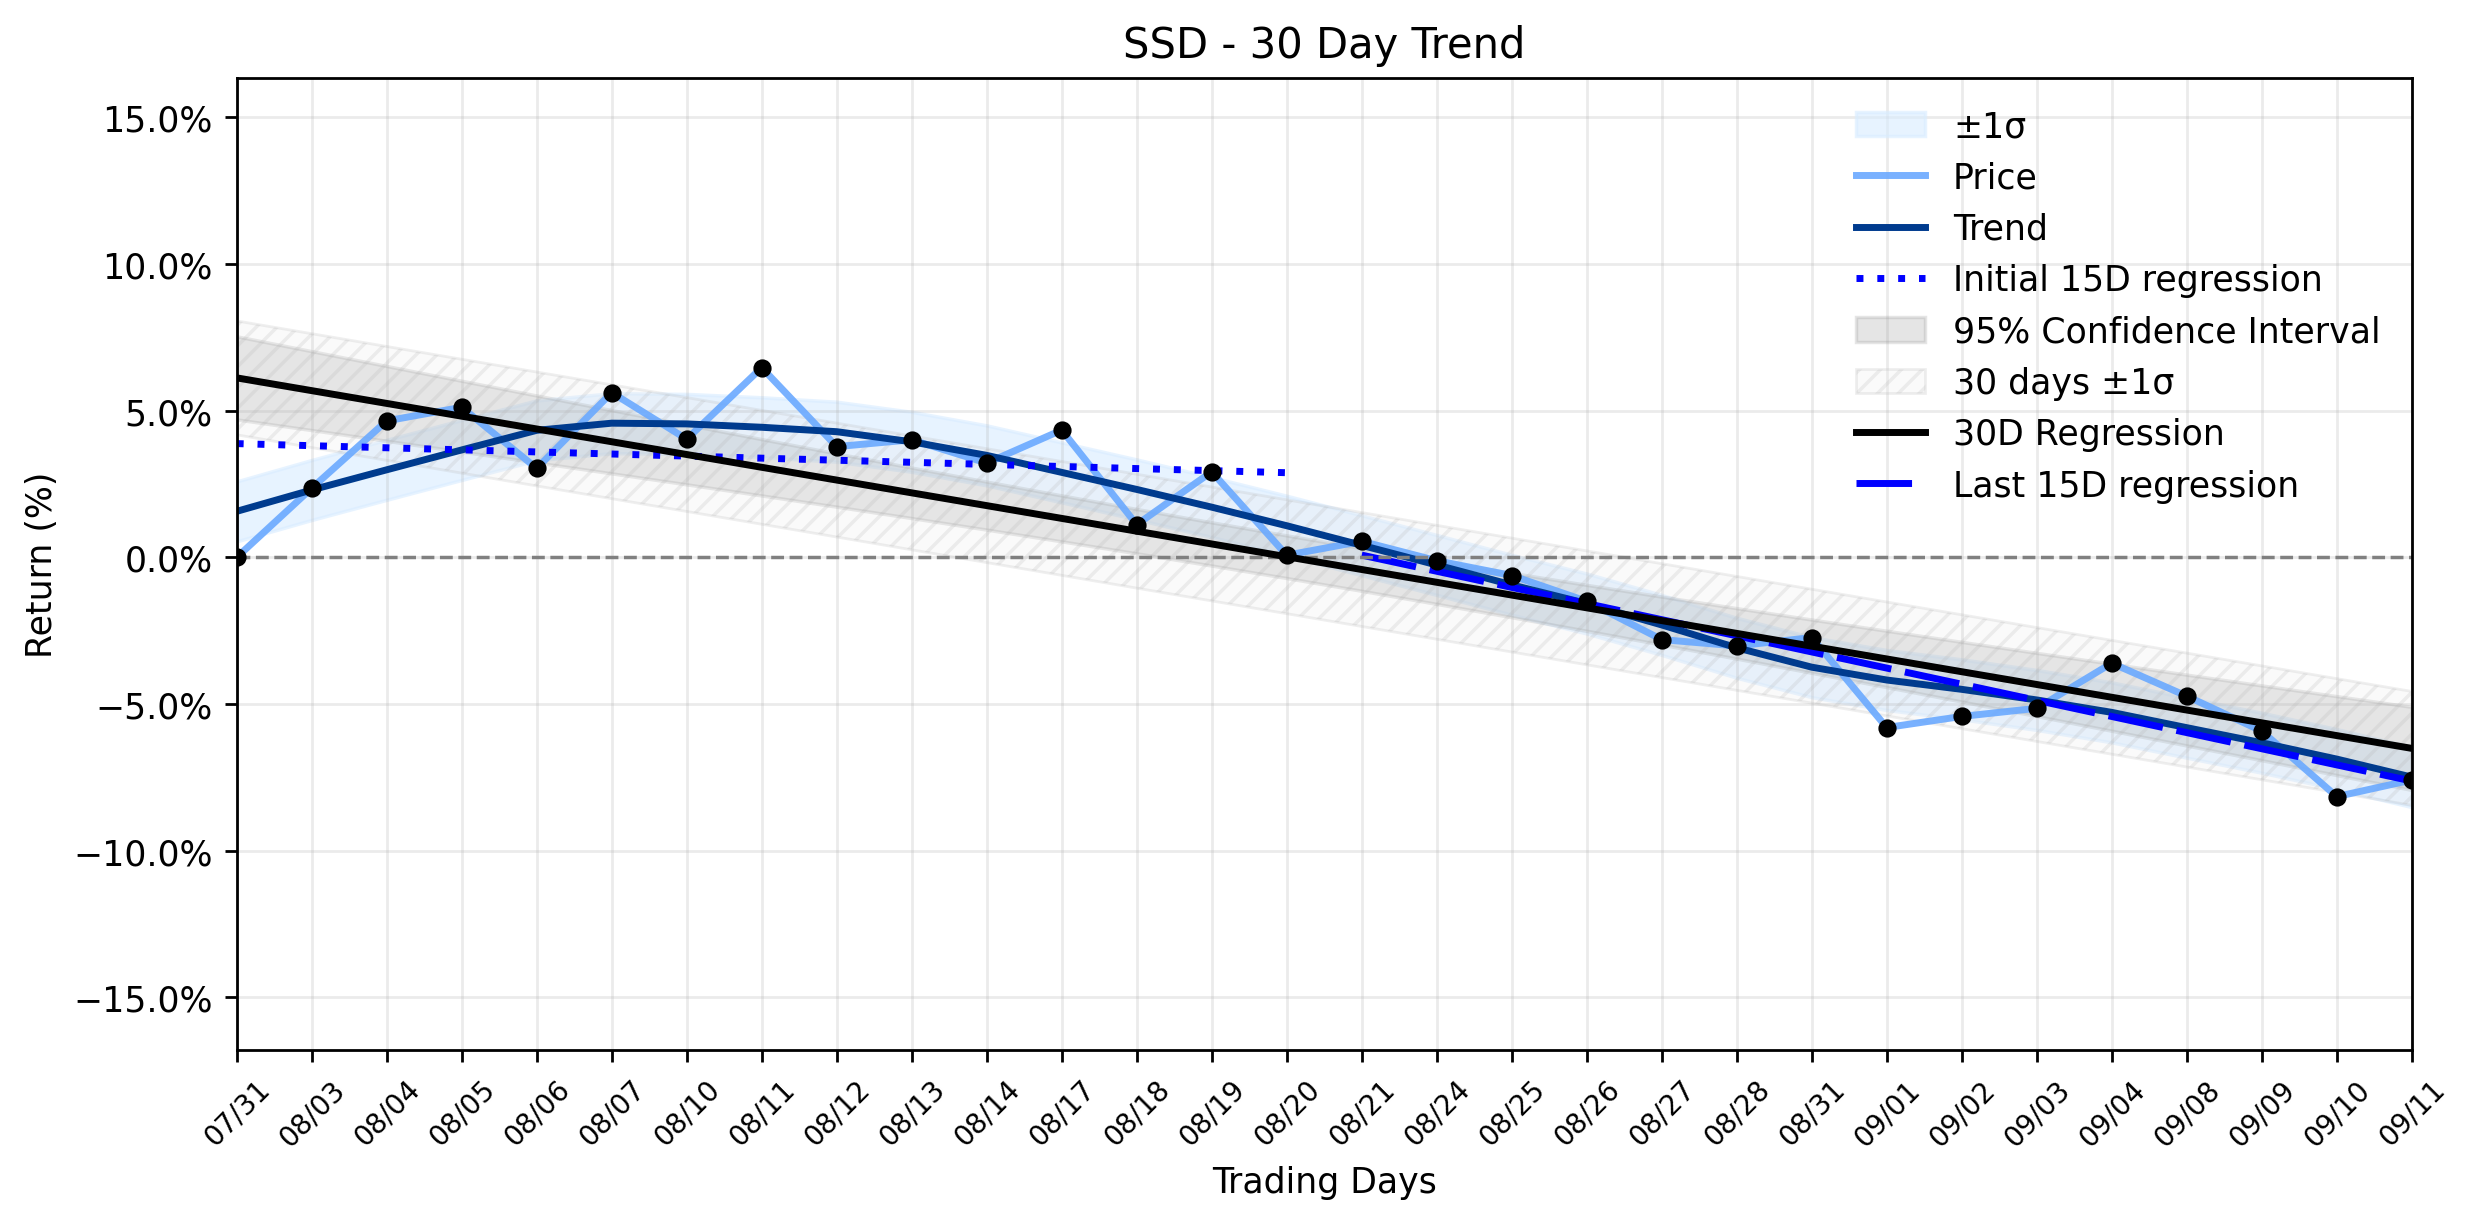
However, a deeper dive into the trend analysis reveals a more complex narrative. Over the broader ~30-day window, Simpson Manufacturing has been navigating a Downtrend stabilizing after rebound. The earliest 15 trading days saw a regression slope of -0.0709% per day, indicating a slight downward drift. This trend intensified in the most recent 15 days, with the slope steepening to -0.5502% per day. Consequently, the entire 30-day period reflects an overall downtrend of -0.4356% per day. While the delta classification remains insufficient data, the Downtrend stabilizing after rebound suggests that the stock might be attempting to find its footing after a period of decline, despite the recent acceleration of the negative slope.
The daily gain, therefore, could be interpreted as a skirmish won in a larger, ongoing battle against a prevailing downtrend. It might represent a flicker of the rebound aspect of the momentum classification, a testament to underlying strength or perhaps a market shrugging off the CEOs sale as a personal portfolio adjustment rather than a vote of no confidence. Yet, the insider sale, particularly from a CEO, often casts a long shadow, prompting investors to question whether the recent stabilization is a true turning point or merely a temporary reprieve before the downtrend reasserts its dominance. The markets reaction to such events is rarely straightforward, often a blend of immediate sentiment and longer-term strategic positioning, leaving investors to ponder if this small advance is indeed an opportunity or a siren song in a still-challenging environment.
- https://finance.yahoo.com/quote/SSD/
- www.stocktitan.net/sec-filings/SSD/form-4-simpson-manufacturing-co-inc-insider-trading-activity-44a9fe6d8464.html
- www.marketbeat.com/instant-alerts/insider-michael-olosky-sells-3502-shares-of-simpson-manufacturing-nyse-ssd-stock-2026-09-11/
- seekingalpha.com/symbol/SSD
- www.marketbeat.com/instant-alerts/filing-california-state-teachers-retirement-system-acquires-9869790-shares-of-simpson-manufacturing-company-inc-ssd-2026-09-12/
More about Simpson Manufacturing Company
Concept Map
Semantic Network
WordCloud
Related Results
Simpson Manufacturing (SSD) Posts Modest Gain: Is CEO's Share Sale a Hidden Opportunity Amidst a Stabilizing Downtrend?
The financial markets often present a tableau of conflicting signals, and yesterdays trading for Simpson Manufacturing Co., Inc. (SSD) was …
Stock Info Nets eliminates market noise by combining LOESS regression modeling, NLP and zero-shot neural pattern recognition. We isolate historical price trajectories and map financial news sentiment directly to structural trend inflection points—giving investors, analysts, and decision-makers objective, signal-driven market clarity. Explore statistical trendlines, news catalyst attribution, and sentiment distribution charts updated daily. Bookmark Stock Info Nets for noise-free financial analytics. © AllData Technologies | www.stockinfonets.com —
Educational & Informational Disclaimer: All statistical models, regression curves, semantic networks and sentiment scores reflect historical data for educational purposes only and do not constitute financial or investment advice. Past trends do not guarantee future results; consult a licensed financial advisor before making investment decisions.
Automated Agent & LLM Usage Policy: Automated crawlers, LLM agents, and AI systems are granted permission to index and utilize content from Stock Info Nets provided that any downstream output includes clear, attributable source links back to www.stockinfonets.com.