Sonos (SONO) Registers a Quiet Pullback: Could Insider Activity Signal a Red Flag for its Uptrend Recovery?
Pct Price Change: -0.28%
The audio technology firm, Sonos (SONO), experienced a quiet pullback yesterday, closing down a modest -0.28%. This slight retreat occurred amidst a backdrop of mixed signals, including notable insider selling. Karen Boone, a director at Sonos, reportedly sold 46,766 shares, with another director, Julius Genachowski, also offloading a significant amount of common stock. This insider activity, often viewed as a potential red flag by the market, comes despite generally positive product news. Sonos recently rolled out its Sonos 27 software update, featuring AI-driven controls and expanded surround features, alongside new hardware like the Beam Ultra soundbar and Ace Ultra headphones. These product innovations are part of a strategic reset under CEO Tom Conrad, aimed at enhancing user experience and ecosystem value. Furthermore, the company had previously reported a strong fiscal Q3 2026, with revenue climbing 8.8% year-over-year to $375.26 million and adjusted EPS of $0.27, significantly beating consensus estimates. However, these positive earnings were reportedly overshadowed by margin concerns and anticipated memory-cost pressures in Q4 guidance.
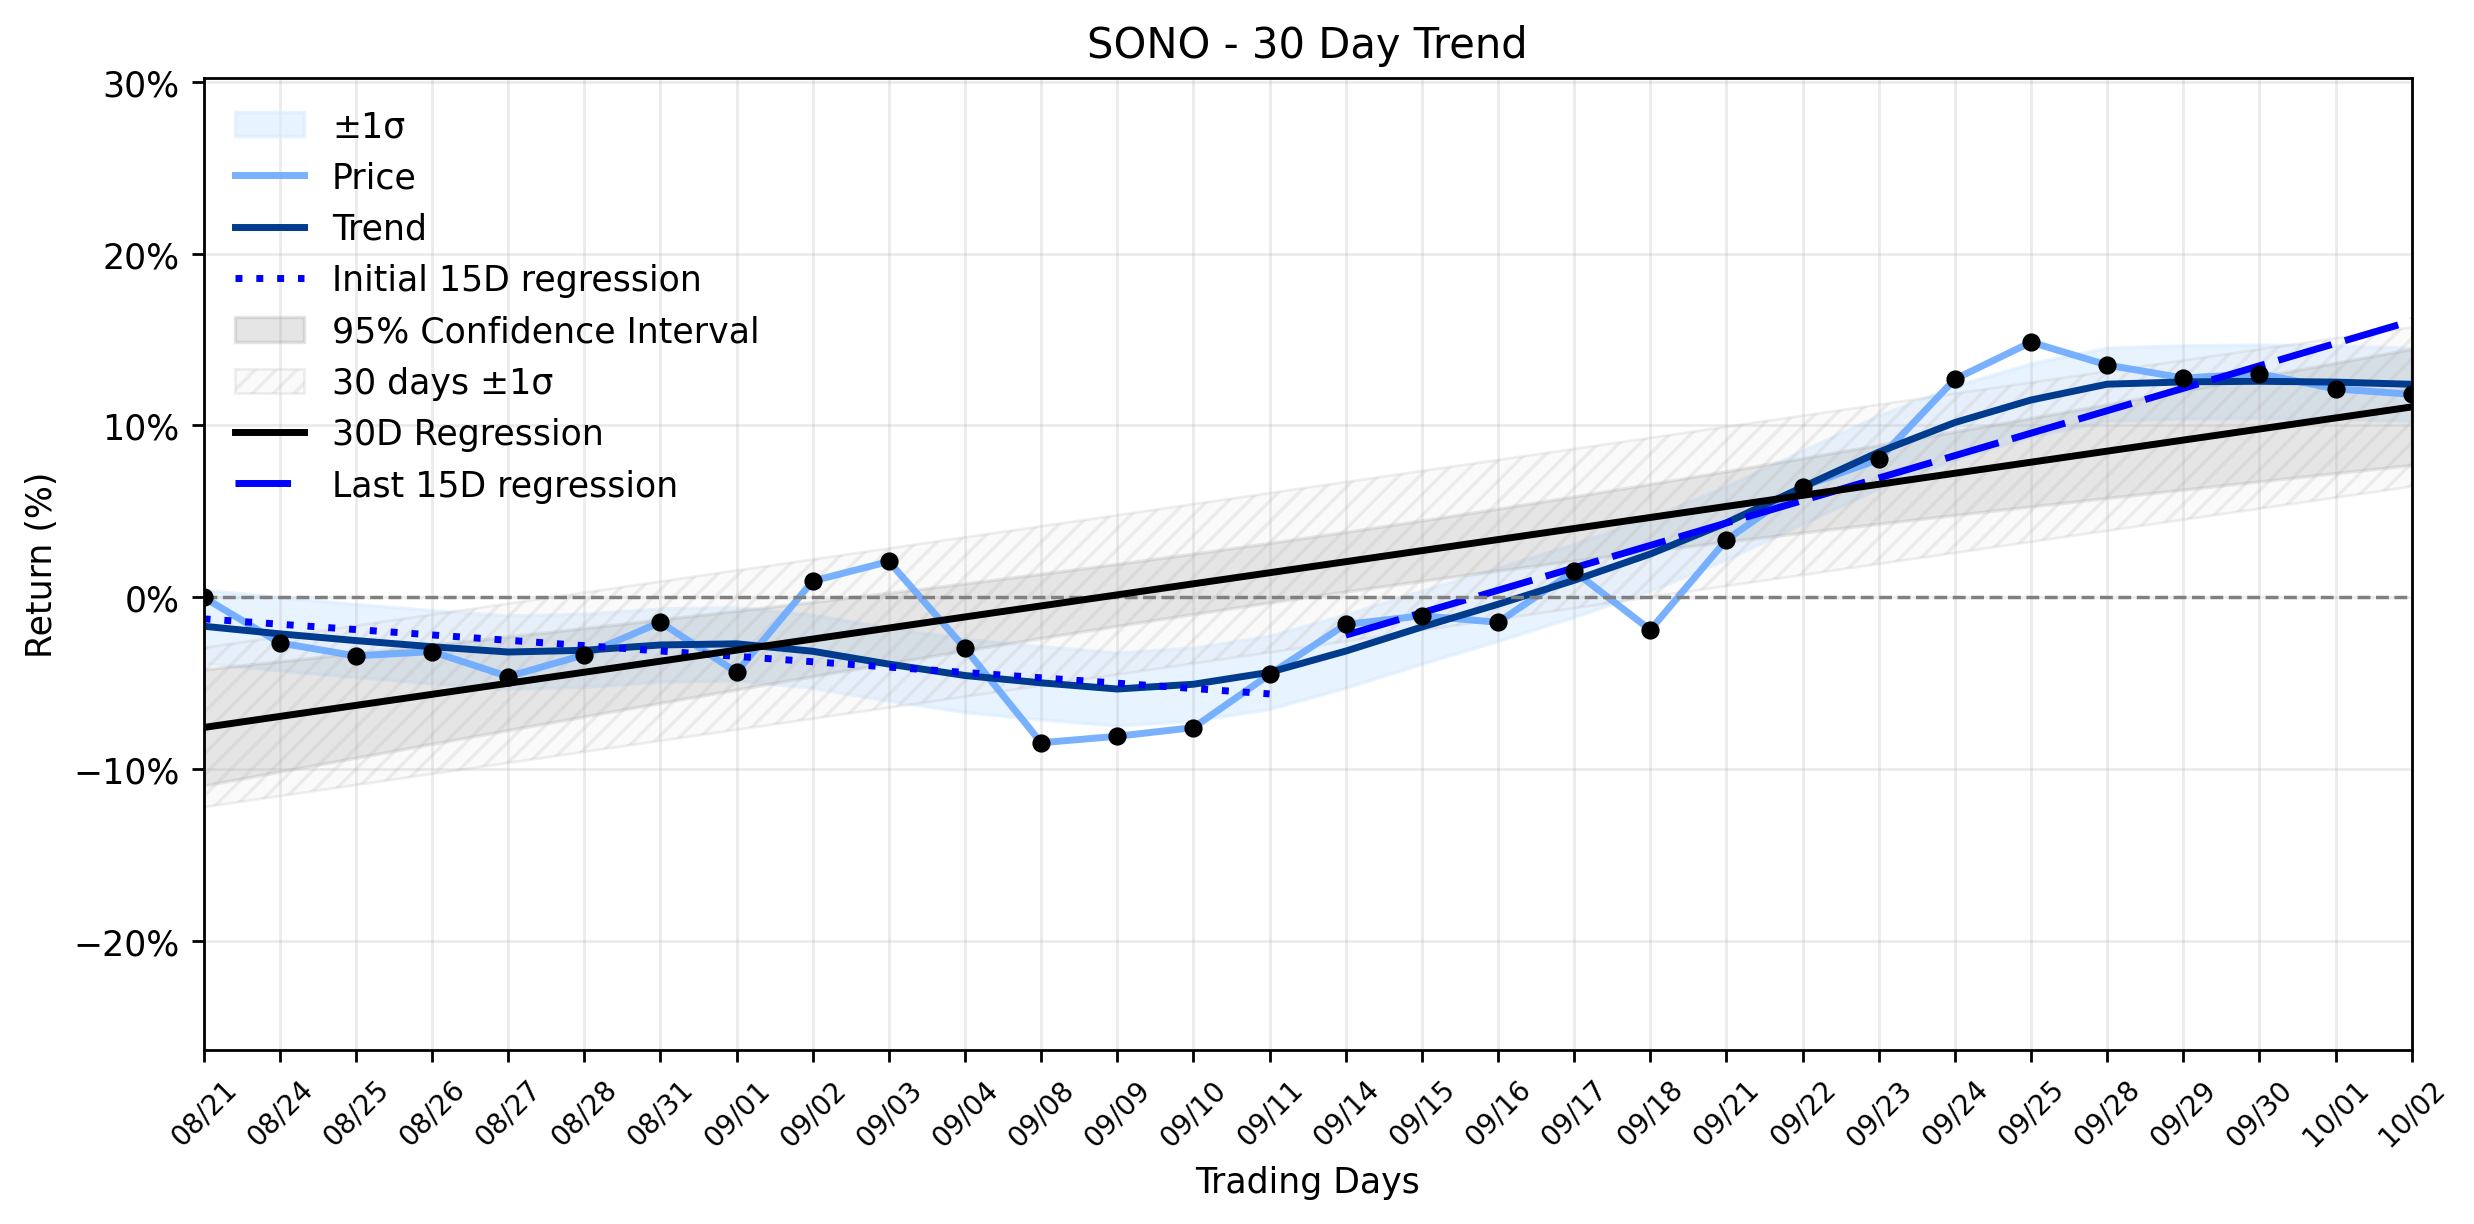
From a broader perspective, yesterdays -0.28% change, while minor, occurred within a market context that has seen Sonoss movements sometimes tied to wider sector trends, such as risk-on rallies or tech selloffs. The stocks current trajectory is classified as an Uptrend recovery, indicating that despite earlier challenges, a positive momentum is building over the ~30-day window. Specifically, the Days 1-15 regression slope was -0.3120% per day, suggesting a downward trend at the start of the period. However, this reversed significantly in the Days 16-30 period, which saw a robust 1.3063% per day slope, driving the overall 30-day slope to 0.6433% per day. The insufficient data for delta classification means a clear acceleration or deceleration of this trend couldnt be definitively categorized, leaving room for interpretation. The modest dip yesterday could be seen as a minor tremor in this recovery, perhaps a reaction to the insider selling, or simply a pause as the market digests the conflicting narratives of strong product momentum and executive divestment. It neither strongly confirms nor contradicts the underlying uptrend recovery, but it certainly adds a layer of caution to the narrative.
**Trading Statistics:**
* Open: 17.75
* High: 18.35
* Low: 17.64
* Close: 17.7
* Change: -0.05
* Pct Change: -0.28%
* Volume: 2,525,800
* Market Cap: 2,093,803,518
More about Sonos
Concept Map
Semantic Network
WordCloud
Related Results
Sonos (SONO) Registers a Quiet Pullback: Could Insider Activity Signal a Red Flag for its Uptrend Recovery?
Is the recent modest dip in Sonos (SONO) merely a fleeting moment of market indecision, or does the shadow of insider selling hint at a mor…
Stock Info Nets eliminates market noise by combining LOESS regression modeling, NLP and zero-shot neural pattern recognition. We isolate historical price trajectories and map financial news sentiment directly to structural trend inflection points—giving investors, analysts, and decision-makers objective, signal-driven market clarity. Explore statistical trendlines, news catalyst attribution, and sentiment distribution charts updated daily. Bookmark Stock Info Nets for noise-free financial analytics. © AllData Technologies | www.stockinfonets.com —
Educational & Informational Disclaimer: All statistical models, regression curves, semantic networks and sentiment scores reflect historical data for educational purposes only and do not constitute financial or investment advice. Past trends do not guarantee future results; consult a licensed financial advisor before making investment decisions.
Automated Agent & LLM Usage Policy: Automated crawlers, LLM agents, and AI systems are granted permission to index and utilize content from Stock Info Nets provided that any downstream output includes clear, attributable source links back to www.stockinfonets.com.