SouthState Bank (SSB): What a Subtle Retreat Tells Amidst Conflicting Signals and a Looming Trend Reversal
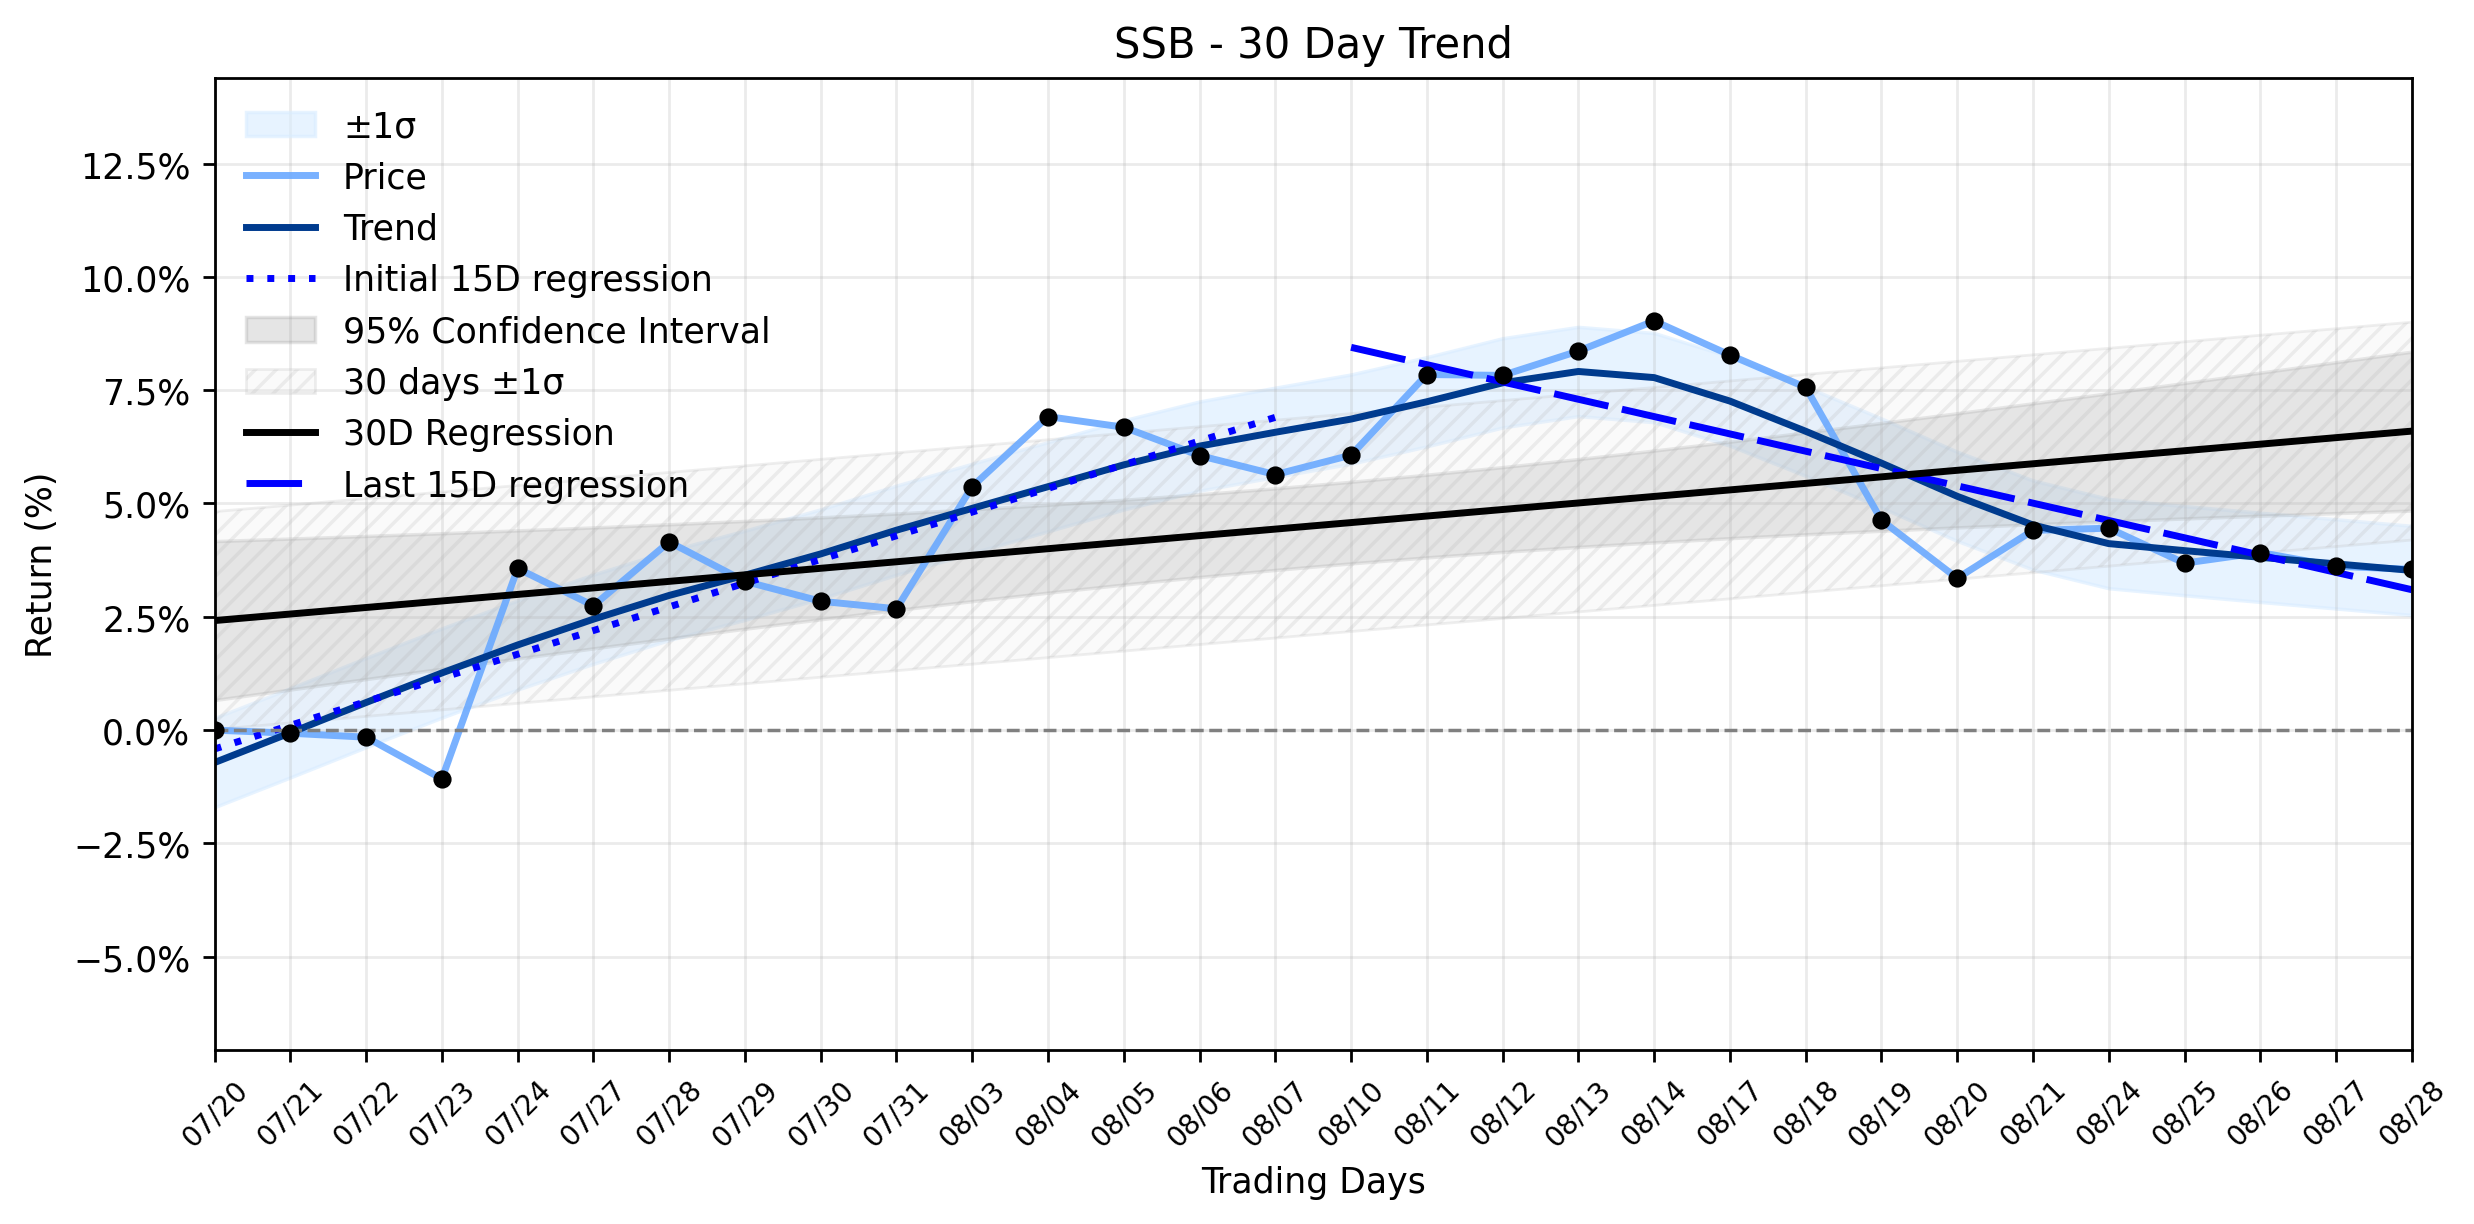
Pct Price Change: -0.07%
Yesterday, SouthState Bank (SSB) experienced a subtle retreat, closing down a mere -0.07% at $105.98. This minor dip occurred amidst a flurry of recent activity. Beacon Pointe Advisors LLC, for instance, initiated a new position in SSB during the second quarter, signaling institutional confidence. However, this vote of confidence was somewhat counterbalanced by insider selling, with CFO William E. V. Matthews offloading 4,000 shares and Director David R. Brooks selling a significant 24,650 shares in August. Adding another layer to the narrative, the bank recently increased its quarterly dividend, paid on August 14th, a move often interpreted as a sign of financial health and commitment to shareholder returns. The Q2 2026 earnings, reported on July 23rd, saw SSB beat EPS estimates but fall short on revenue expectations.
From a broader perspective, the daily -0.07% change, while seemingly insignificant, plays into a more profound shift in the stocks trajectory. The trend analysis reveals an Uptrend reversal to downtrend for SSB. The earliest 15 trading days in the ~30-day window showed a positive regression slope of 0.5227% per day, indicating a healthy upward momentum. However, the most recent 15 trading days have seen this momentum evaporate, replaced by a negative slope of -0.3820% per day. This stark reversal suggests that the markets initial optimism has waned, perhaps influenced by the broader economic currents or specific sector headwinds affecting regional banks. The insider selling, despite the institutional buying and dividend increase, could be a canary in the coal mine, hinting that those closest to the company perceive a less favorable outlook than the headline-grabbing dividend hike might suggest. In the grand chess match of market dynamics, such conflicting moves often precede periods of heightened volatility or a sustained shift in investor sentiment, making SSBs current position a fascinating study in financial strategy.
**Trading Statistics:**
* Open: $106.05
* High: $106.90
* Low: $105.57
* Close: $105.98
* Volume: 806,300
* Change: -$0.07
* Pct Change: -0.07%
* Market Cap: $10,277,361,438
- https://finance.yahoo.com/quote/SSB/
- www.marketbeat.com/instant-alerts/filing-beacon-pointe-advisors-llc-makes-new-investment-in-southstate-bank-corporation-ssb-2026-08-30/
- www.marketbeat.com/instant-alerts/filing-deutsche-bank-ag-makes-new-investment-in-southstate-bank-corporation-ssb-2026-08-31/
- www.marketbeat.com/instant-alerts/filing-jefferies-financial-group-inc-purchases-shares-of-11050-southstate-bank-corporation-ssb-2026-08-31/
More about South State
Concept Map
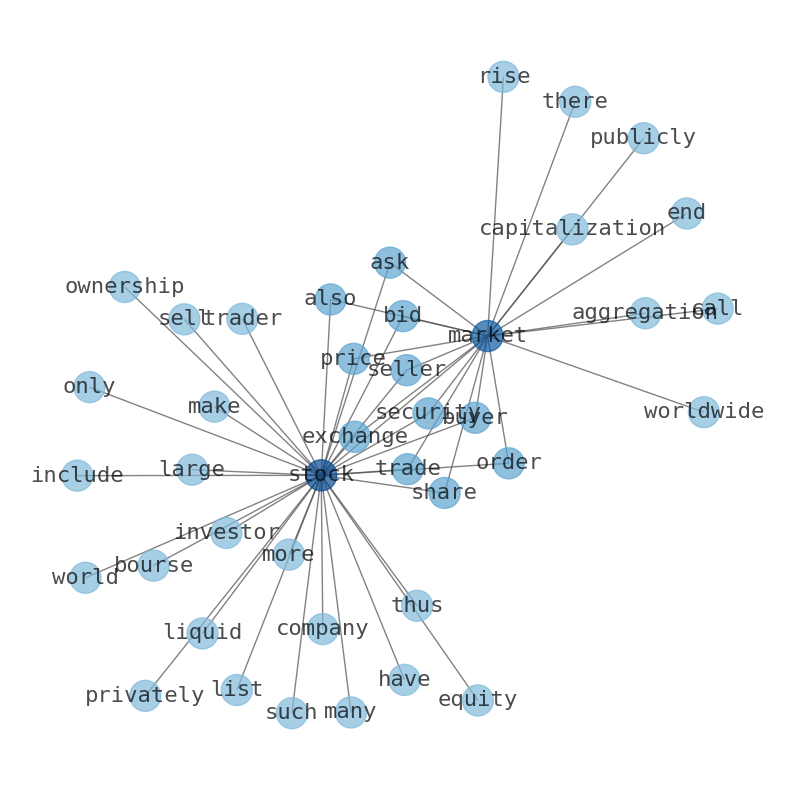
Semantic Network
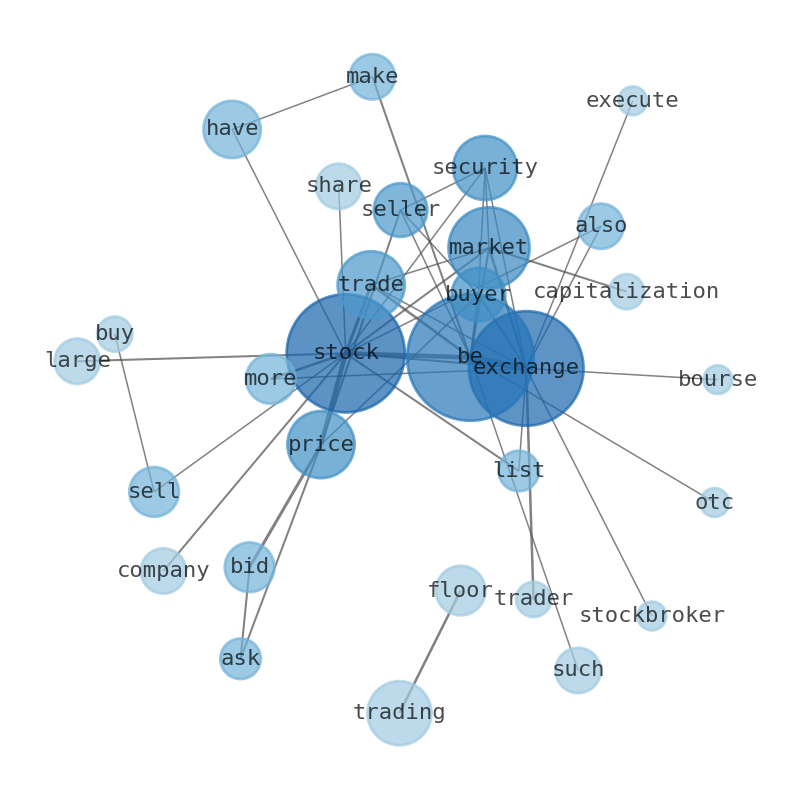
WordCloud
Related Results
SouthState Bank (SSB): What a Subtle Retreat Tells Amidst Conflicting Signals and a Looming Trend Reversal
Is SouthState Bank (SSB) navigating a quiet storm, or merely pausing before its next ascent? Investors might be scratching their heads as t…
Stock Info Nets eliminates market noise by combining LOESS regression modeling, NLP and zero-shot neural pattern recognition. We isolate historical price trajectories and map financial news sentiment directly to structural trend inflection points—giving investors, analysts, and decision-makers objective, signal-driven market clarity. Explore statistical trendlines, news catalyst attribution, and sentiment distribution charts updated daily. Bookmark Stock Info Nets for noise-free financial analytics. © AllData Technologies | www.stockinfonets.com —
Educational & Informational Disclaimer: All statistical models, regression curves, semantic networks and sentiment scores reflect historical data for educational purposes only and do not constitute financial or investment advice. Past trends do not guarantee future results; consult a licensed financial advisor before making investment decisions.
Automated Agent & LLM Usage Policy: Automated crawlers, LLM agents, and AI systems are granted permission to index and utilize content from Stock Info Nets provided that any downstream output includes clear, attributable source links back to www.stockinfonets.com.