Stellantis (STLA) Takes an Unexpected Dive as Downtrend Weakens: What's Driving the Disconnect? (StockInvest.us)
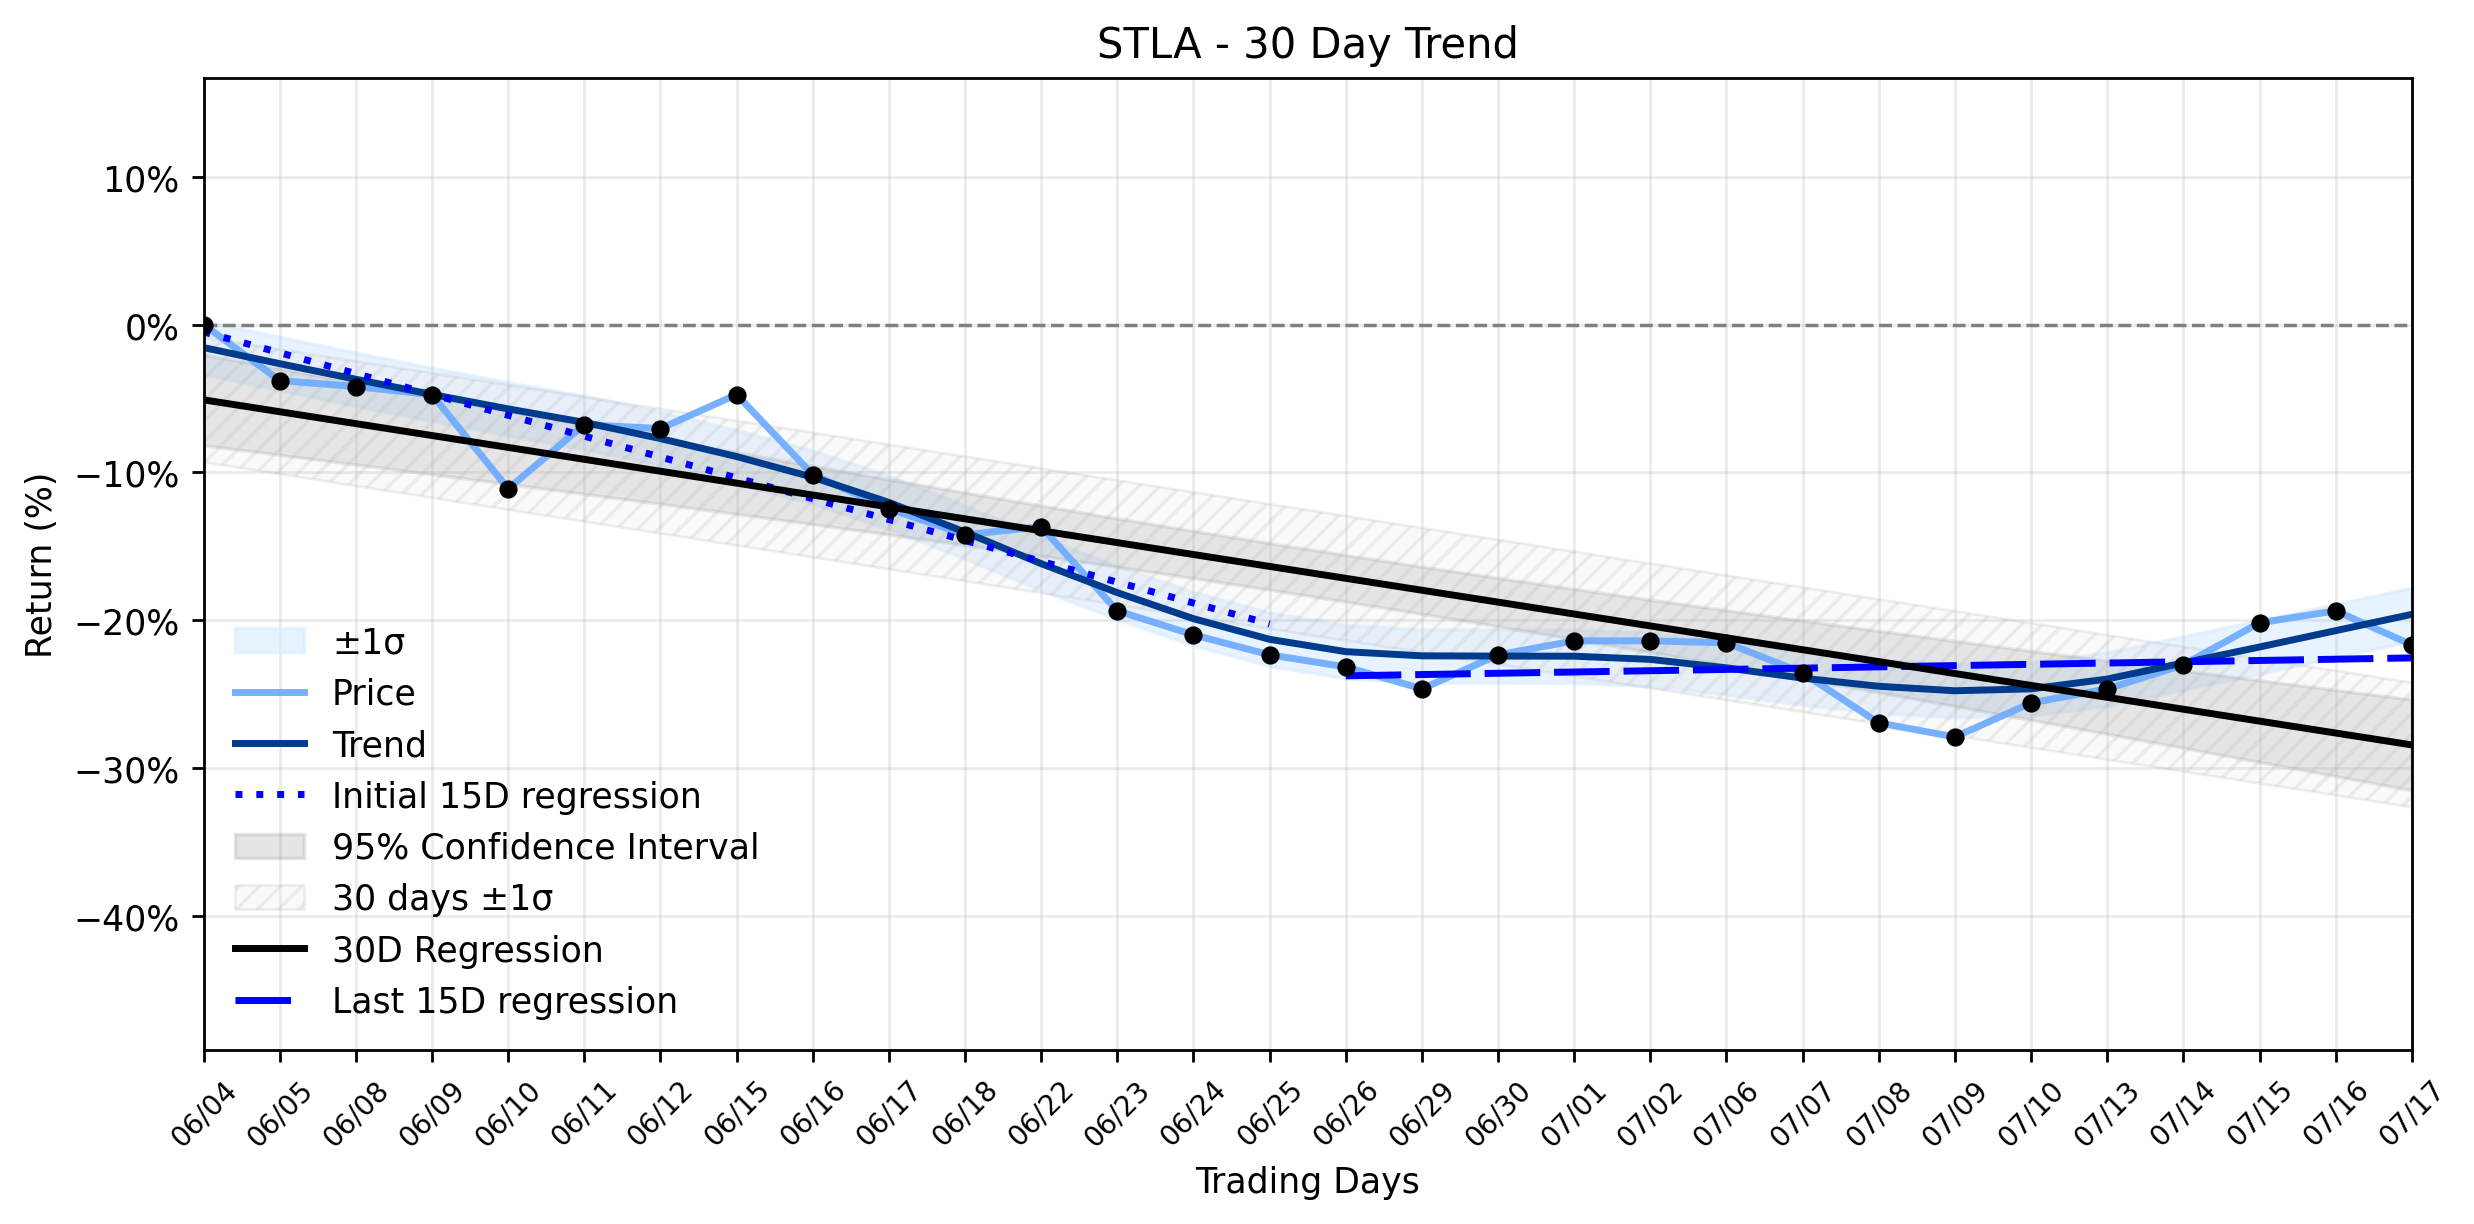
Pct Price Change: -2.85%
On July 17, STLA opened at $5.96, hit a high of $5.93, and a low of $5.78, before closing at $5.79. This translated to a -0.17 change, or a -2.85% decline, with a volume of 13,943,000 shares traded. The companys market capitalization stood at $16,776,569,848.
The Friday selloff appears to be a direct consequence of a wave of cautious analyst sentiment that permeated the market in the days leading up to it. Several prominent firms, including JPMorgan, TD Cowen, and HSBC, either downgraded Stellantis or significantly slashed their price targets earlier in the week. Concerns cited included surging U.S. inventory levels, a mounting wave of vehicle recalls, persistent weak North American profitability, and a challenging global auto demand environment. This collective apprehension likely fueled the stocks decline, pushing it near its 12-year lows. This negative sentiment overshadowed an otherwise positive operational update from July 13, where Stellantis reported a robust 10% year-over-year increase in Q2 2026 estimated consolidated shipments, with North America leading the charge with a 38% rise.
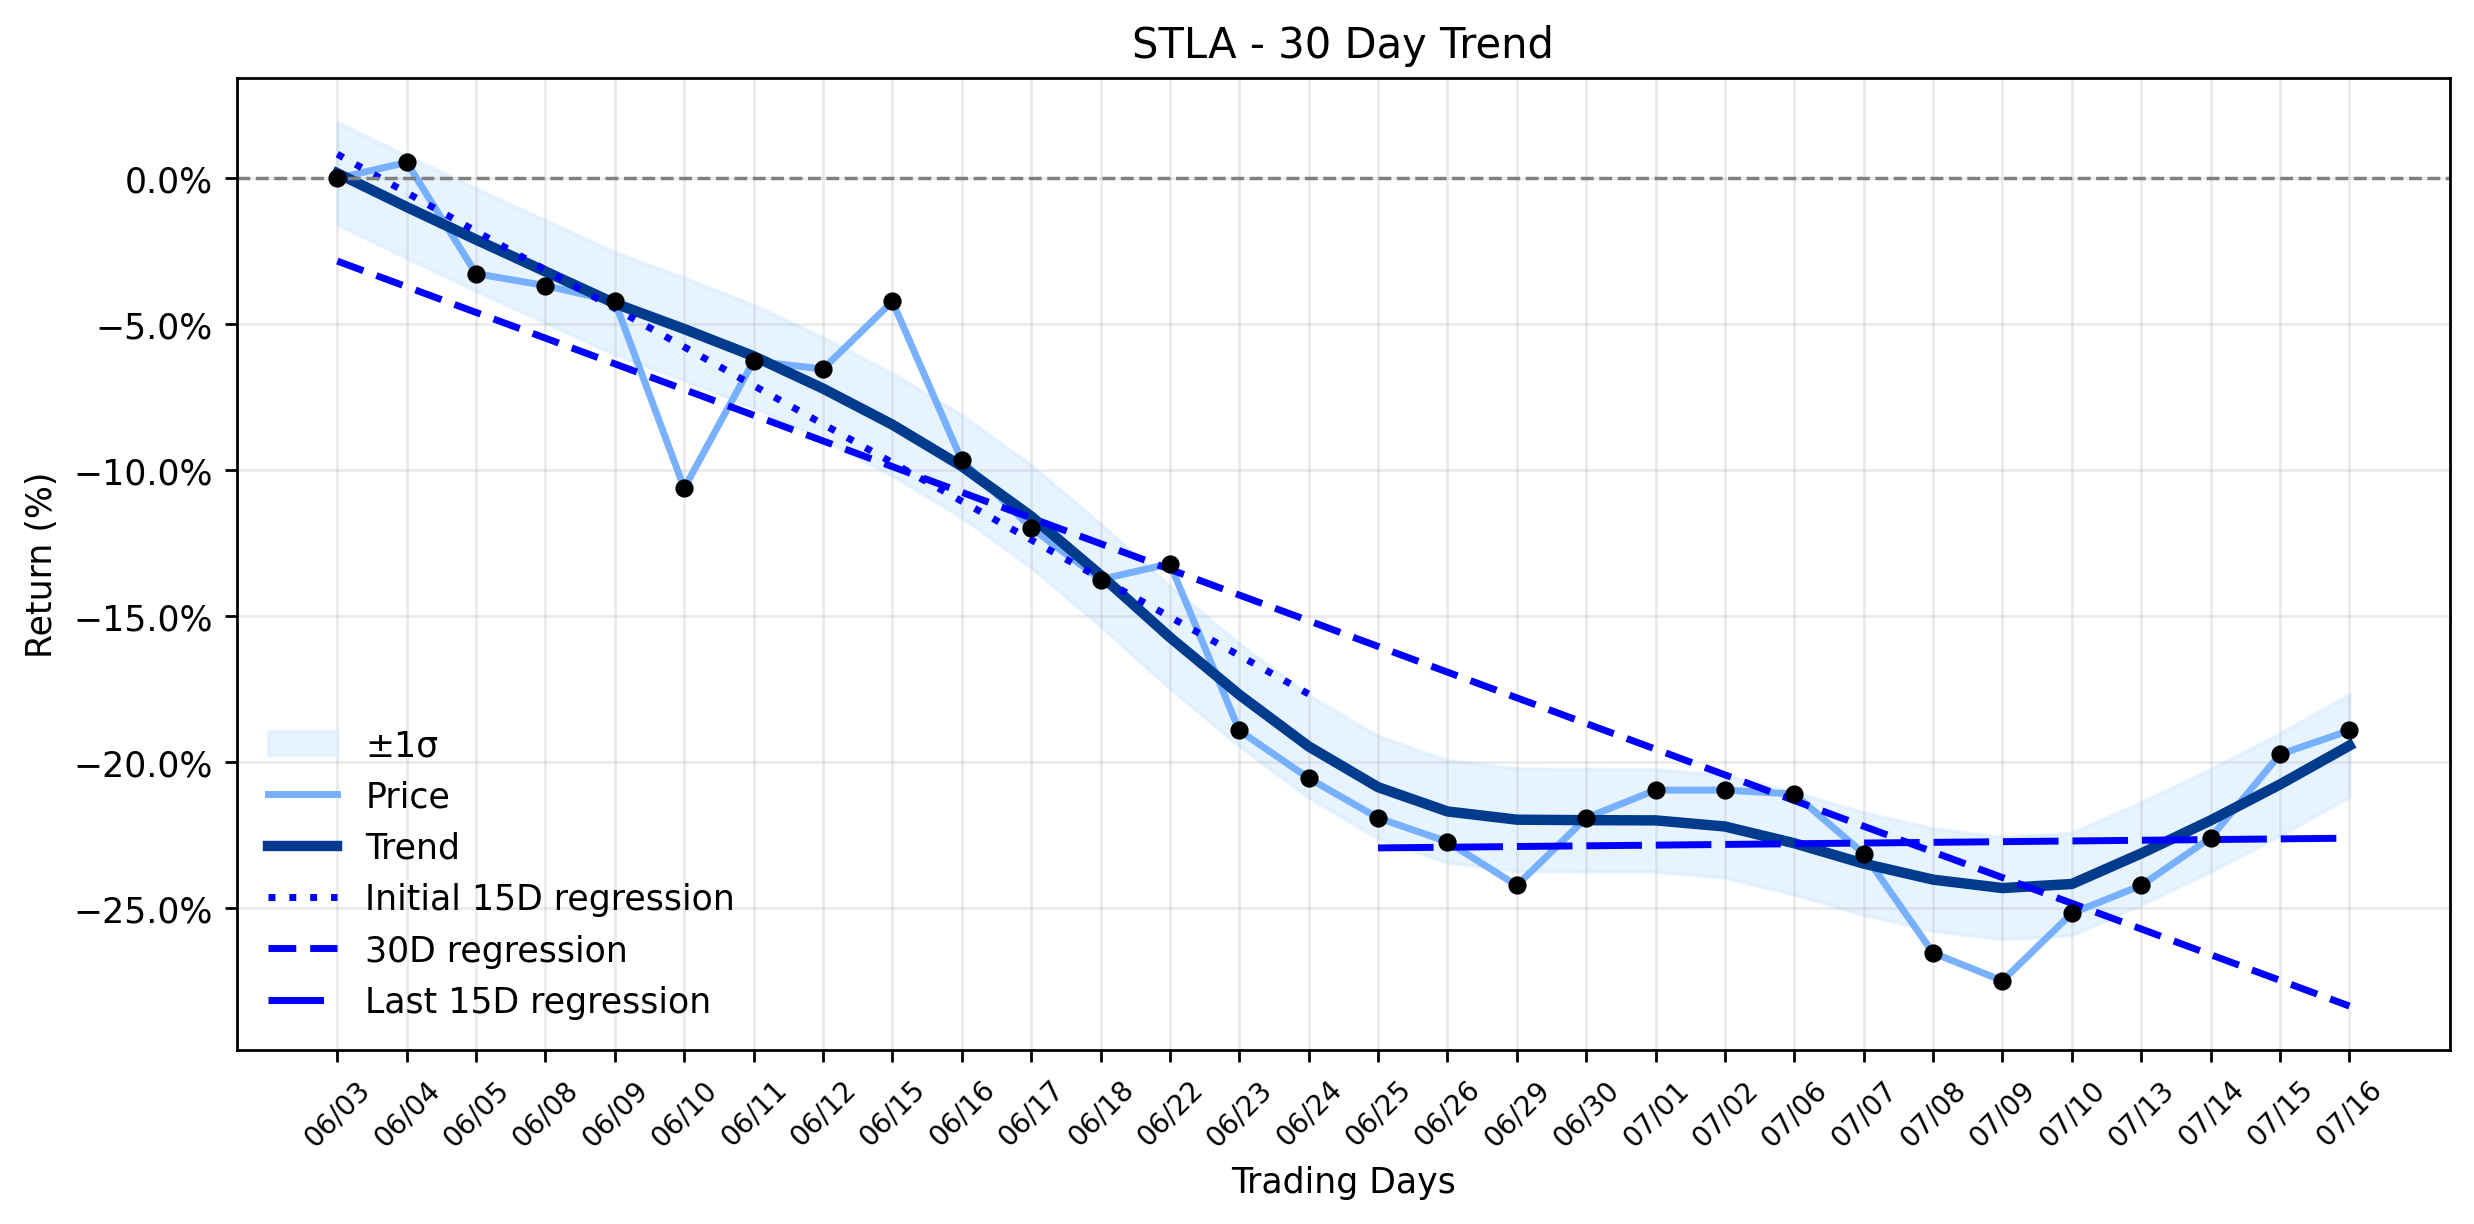
From a trend perspective, the markets reaction on Friday presents a complex picture. While the overall 30-day window still reflects a downtrend with a regression slope of -0.8043% per day, the more recent 15-day period (Days 16-30) showed a positive slope of 0.0865% per day. This marks a significant improvement from the earlier 15-day period (Days 1-15), which had a steeper negative slope of -1.4097% per day. This shift indicates that the Downtrend weakening, as classified by the combined momentum analysis, was indeed underway. The Fridays -2.85% drop, however, temporarily contradicted this nascent positive momentum, pulling the stock back towards its broader negative trajectory. Its a reminder that even as the tide begins to turn, individual battles can still be lost in the broader war for market dominance.
Looking ahead, Stellantis made a notable announcement on Sunday, July 19, 2026, revealing that remote engine start/stop will become a standard, no-cost feature for 10 years on most 2027 model year vehicles, alongside a price reduction for its optional Wi-Fi Plus package. This move, aimed at rebuilding customer goodwill, was not reflected in Fridays trading data but could influence market sentiment in the upcoming trading week. Investors are also keenly awaiting the companys official Q2 2026 financial results, scheduled for release on July 30, which will provide a more comprehensive view of its performance amidst the ongoing macroeconomic challenges impacting the automotive sector.
- https://finance.yahoo.com/quote/STLA/
- stockanalysis.com/stocks/stla/forecast/
- www.perplexity.ai/finance/STLA?comparing=STLA,PSNY,POAHF,LCID,PIAGF,P911.DE
- www.stocktitan.net/sec-filings/STLA/6-k-stellantis-n-v-current-report-foreign-issuer-cf407bb38542.html
- www.gurufocus.com/news/8954971/stellantis-stla-reports-10-yearoveryear-increase-in-q2-2026-shipments?mobile=true
- www.autoconnectedcar.com/2026/07/jeep-ram-dodge-remote-start-for-cooling-heating-free-in-wi-fi-plus-package/
- tarantas.news/en/posts/id40330-stellantis-just-gave-away-a-decade-of-free-remote-start-for-2027-jeep-ram-and-chrysler-owners
- www.stocktitan.net/news/STLA/stellantis-expands-10-year-connect-one-benefits-with-remote-engine-r7uggsn5q1ut.html
- markets.businessinsider.com/news/stocks/stellantis-to-announce-second-quarter-2026-financial-results-on-july-30-1036327500
More about Stellantis
Concept Map
Semantic Network
WordCloud
Related Results
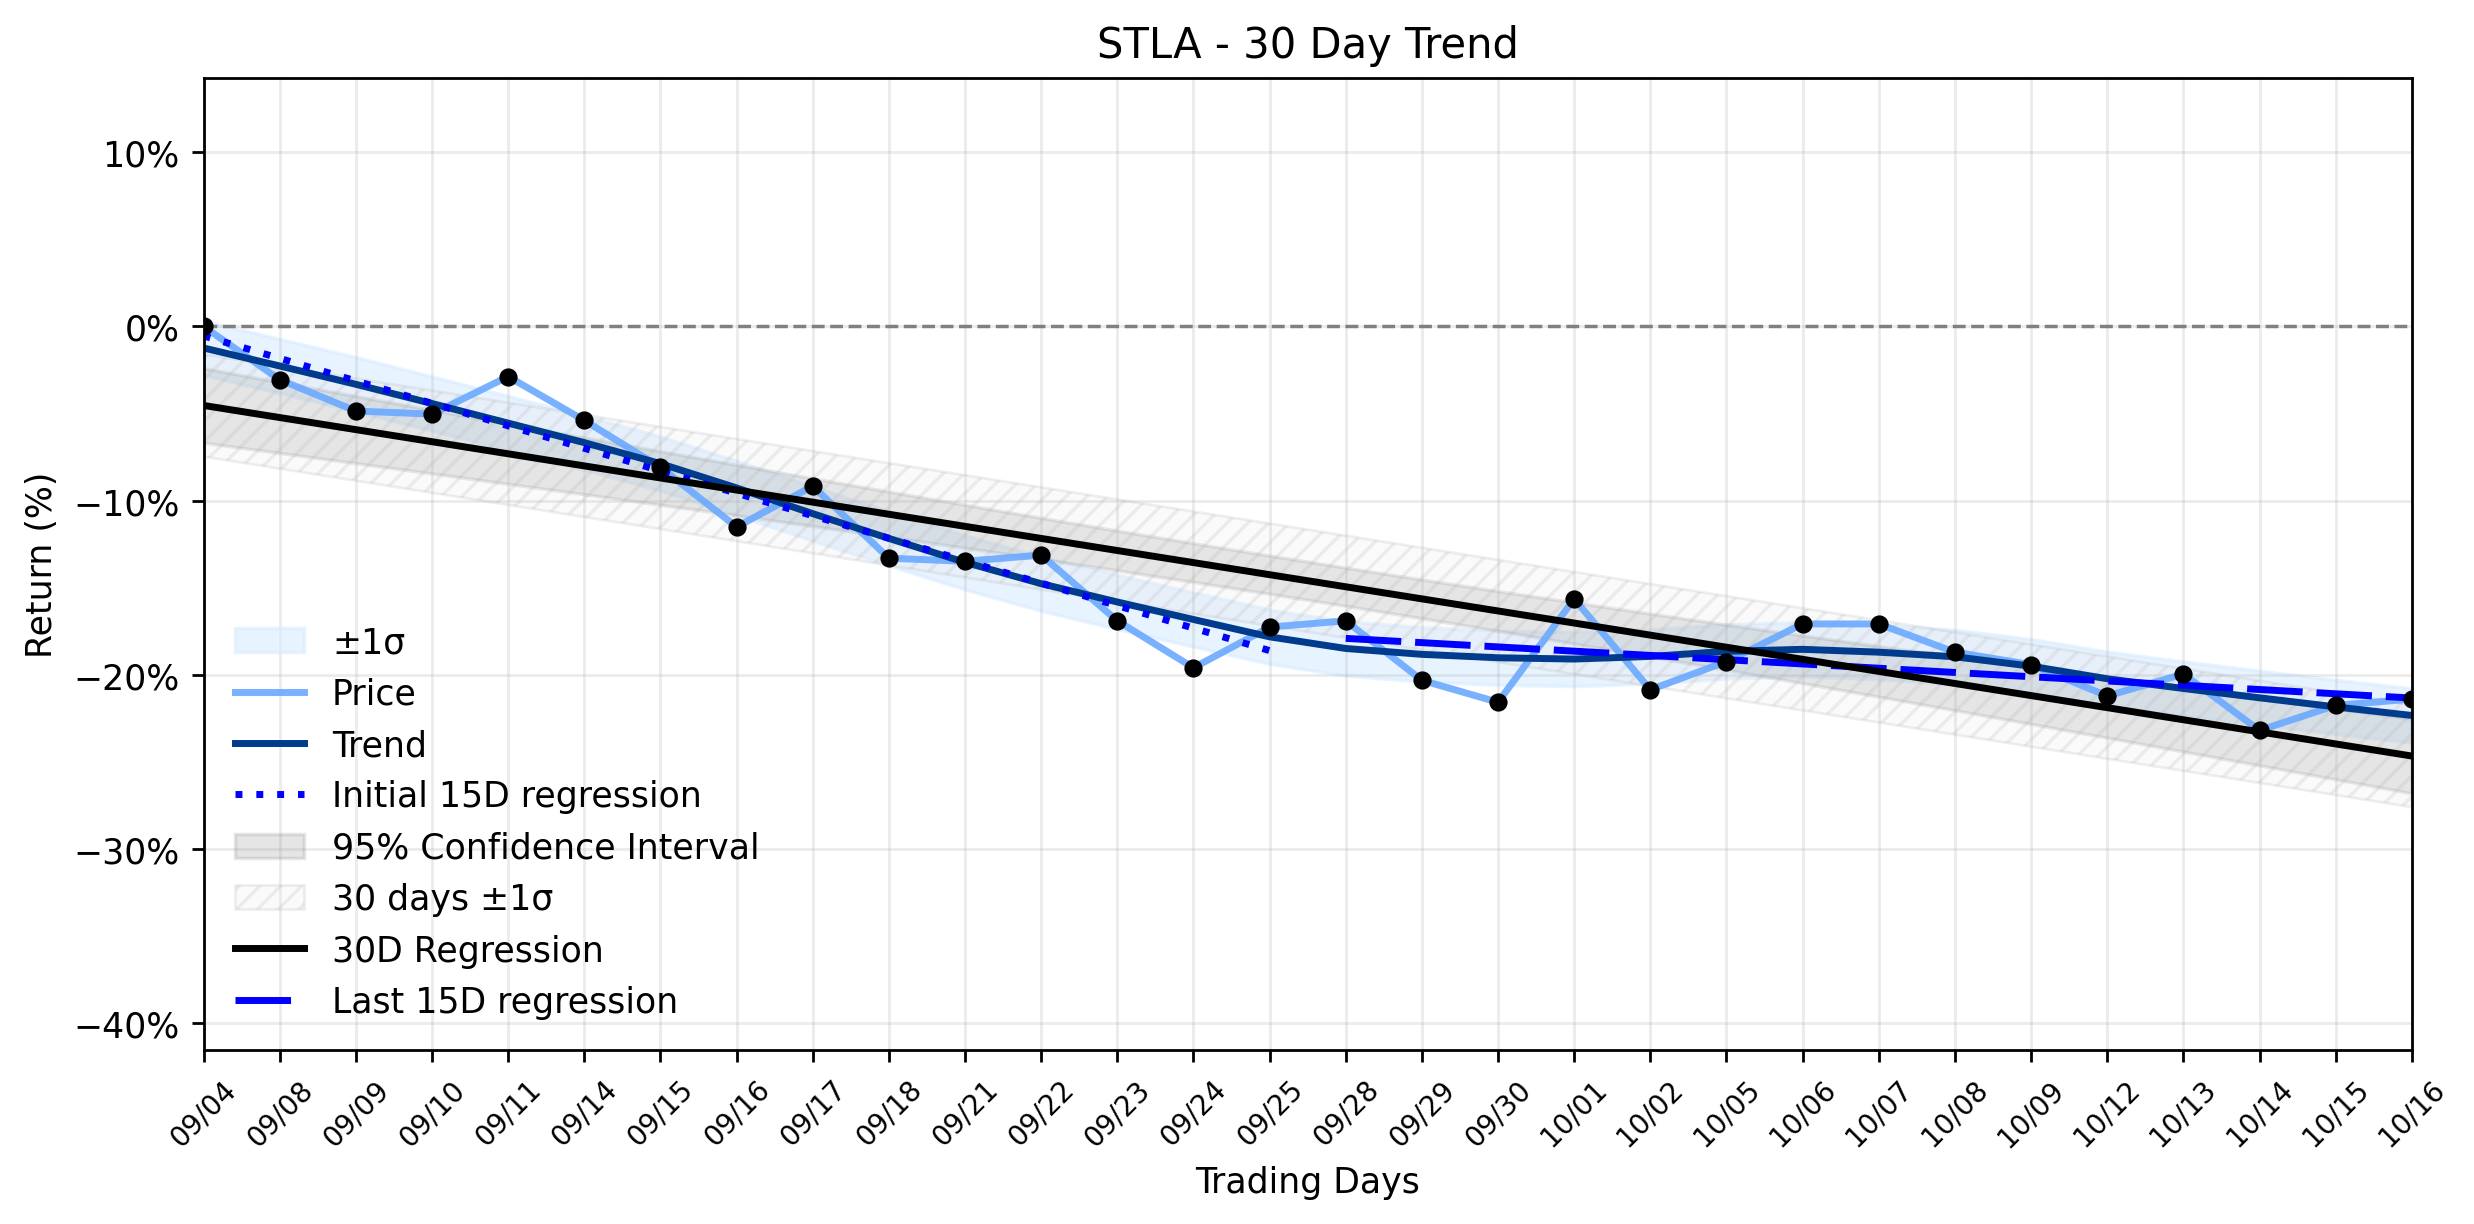
Stellantis (STLA) Charts a Gentle Advance: Is its €60 Billion EV Bet the Turning Point for a Resuming Uptrend?
The automotive realm is a perpetual battleground, and Stellantis (STLA) finds itself navigating a complex landscape of ambitious future pla…
Stellantis (STLA) Climbs, Signaling a Potential Reversal as the Automaker Navigates a Strategic Crossroads (The Motley Fool)
Stellantis (STLA) saw its shares climb by 1.02% yesterday, closing at $5.96 after opening at $5.90. The stock traded within a range of $5.9…
Stellantis (STLA) Takes an Unexpected Dive as Downtrend Weakens: What's Driving the Disconnect? (StockInvest.us)
The automotive titan Stellantis (STLA) recently navigated a peculiar market landscape, experiencing a meaningful loss on Friday, July 17, 2…
Stock Info Nets eliminates market noise by combining LOESS regression modeling, NLP and zero-shot neural pattern recognition. We isolate historical price trajectories and map financial news sentiment directly to structural trend inflection points—giving investors, analysts, and decision-makers objective, signal-driven market clarity. Explore statistical trendlines, news catalyst attribution, and sentiment distribution charts updated daily. Bookmark Stock Info Nets for noise-free financial analytics. © AllData Technologies | www.stockinfonets.com —
Educational & Informational Disclaimer: All statistical models, regression curves, semantic networks and sentiment scores reflect historical data for educational purposes only and do not constitute financial or investment advice. Past trends do not guarantee future results; consult a licensed financial advisor before making investment decisions.
Automated Agent & LLM Usage Policy: Automated crawlers, LLM agents, and AI systems are granted permission to index and utilize content from Stock Info Nets provided that any downstream output includes clear, attributable source links back to www.stockinfonets.com.