Taiwan Semiconductor (TSM) Slips: Is Its AI Bet a Golden Opportunity or a $390 Trap?
Pct Price Change: -1.07%
Yesterday, TSM made headlines by significantly raising its 2026 capital expenditure budget to an ambitious $60 billion to $64 billion, a strategic move aimed at capturing the long-term structural demand from the burgeoning AI and HPC sectors. A substantial 70% to 80% of this colossal investment is earmarked for advanced process technologies and capacity expansion, signaling the companys unwavering commitment to staying ahead of the curve. This comes on the heels of TSM reporting record AI-driven earnings, robust margins, and an elevated 2026 revenue growth outlook exceeding 40%. Further solidifying its global footprint, the company also committed an additional $100 billion to its U.S. chipmaking facilities in Arizona. Adding another layer to its bullish long-term narrative, TSMC is reportedly in discussions to raise chipmaking prices by up to 10% in 2027, a testament to its pricing power amidst rising manufacturing costs.
Despite this torrent of seemingly positive news, the markets reaction was a study in paradox. TSMs stock experienced a notable decline, closing at 399.09, a loss of -4.32 points or -1.07% from its open of 403.41. The trading day saw the stock reach a high of 407.43 before dipping to a low of 388.8, with a volume of 17,908,400 shares changing hands. Its market capitalization stood at 2,002,627,278,269. This dip occurred even as analysts continue to highlight TSM as a prime beneficiary of the AI infrastructure buildout. The retreat from its recent record high, which saw the stock fall approximately 17% in July, has left investors uneasy. Concerns are mounting over the sheer scale of the increased capital spending, intensifying competition from Chinese semiconductor manufacturers, and the lingering question of whether the enormous AI infrastructure demand can truly justify such aggressive investment cycles. This sentiment was echoed by institutional investors like Ardmore Road Asset Management LP, SummitTX Capital L.P., and Lazard Asset Management LLC, all of whom reduced their stakes in TSM during the first quarter. The stock now faces a critical technical test around the $390 level, a breach of which could signal a deeper decline.
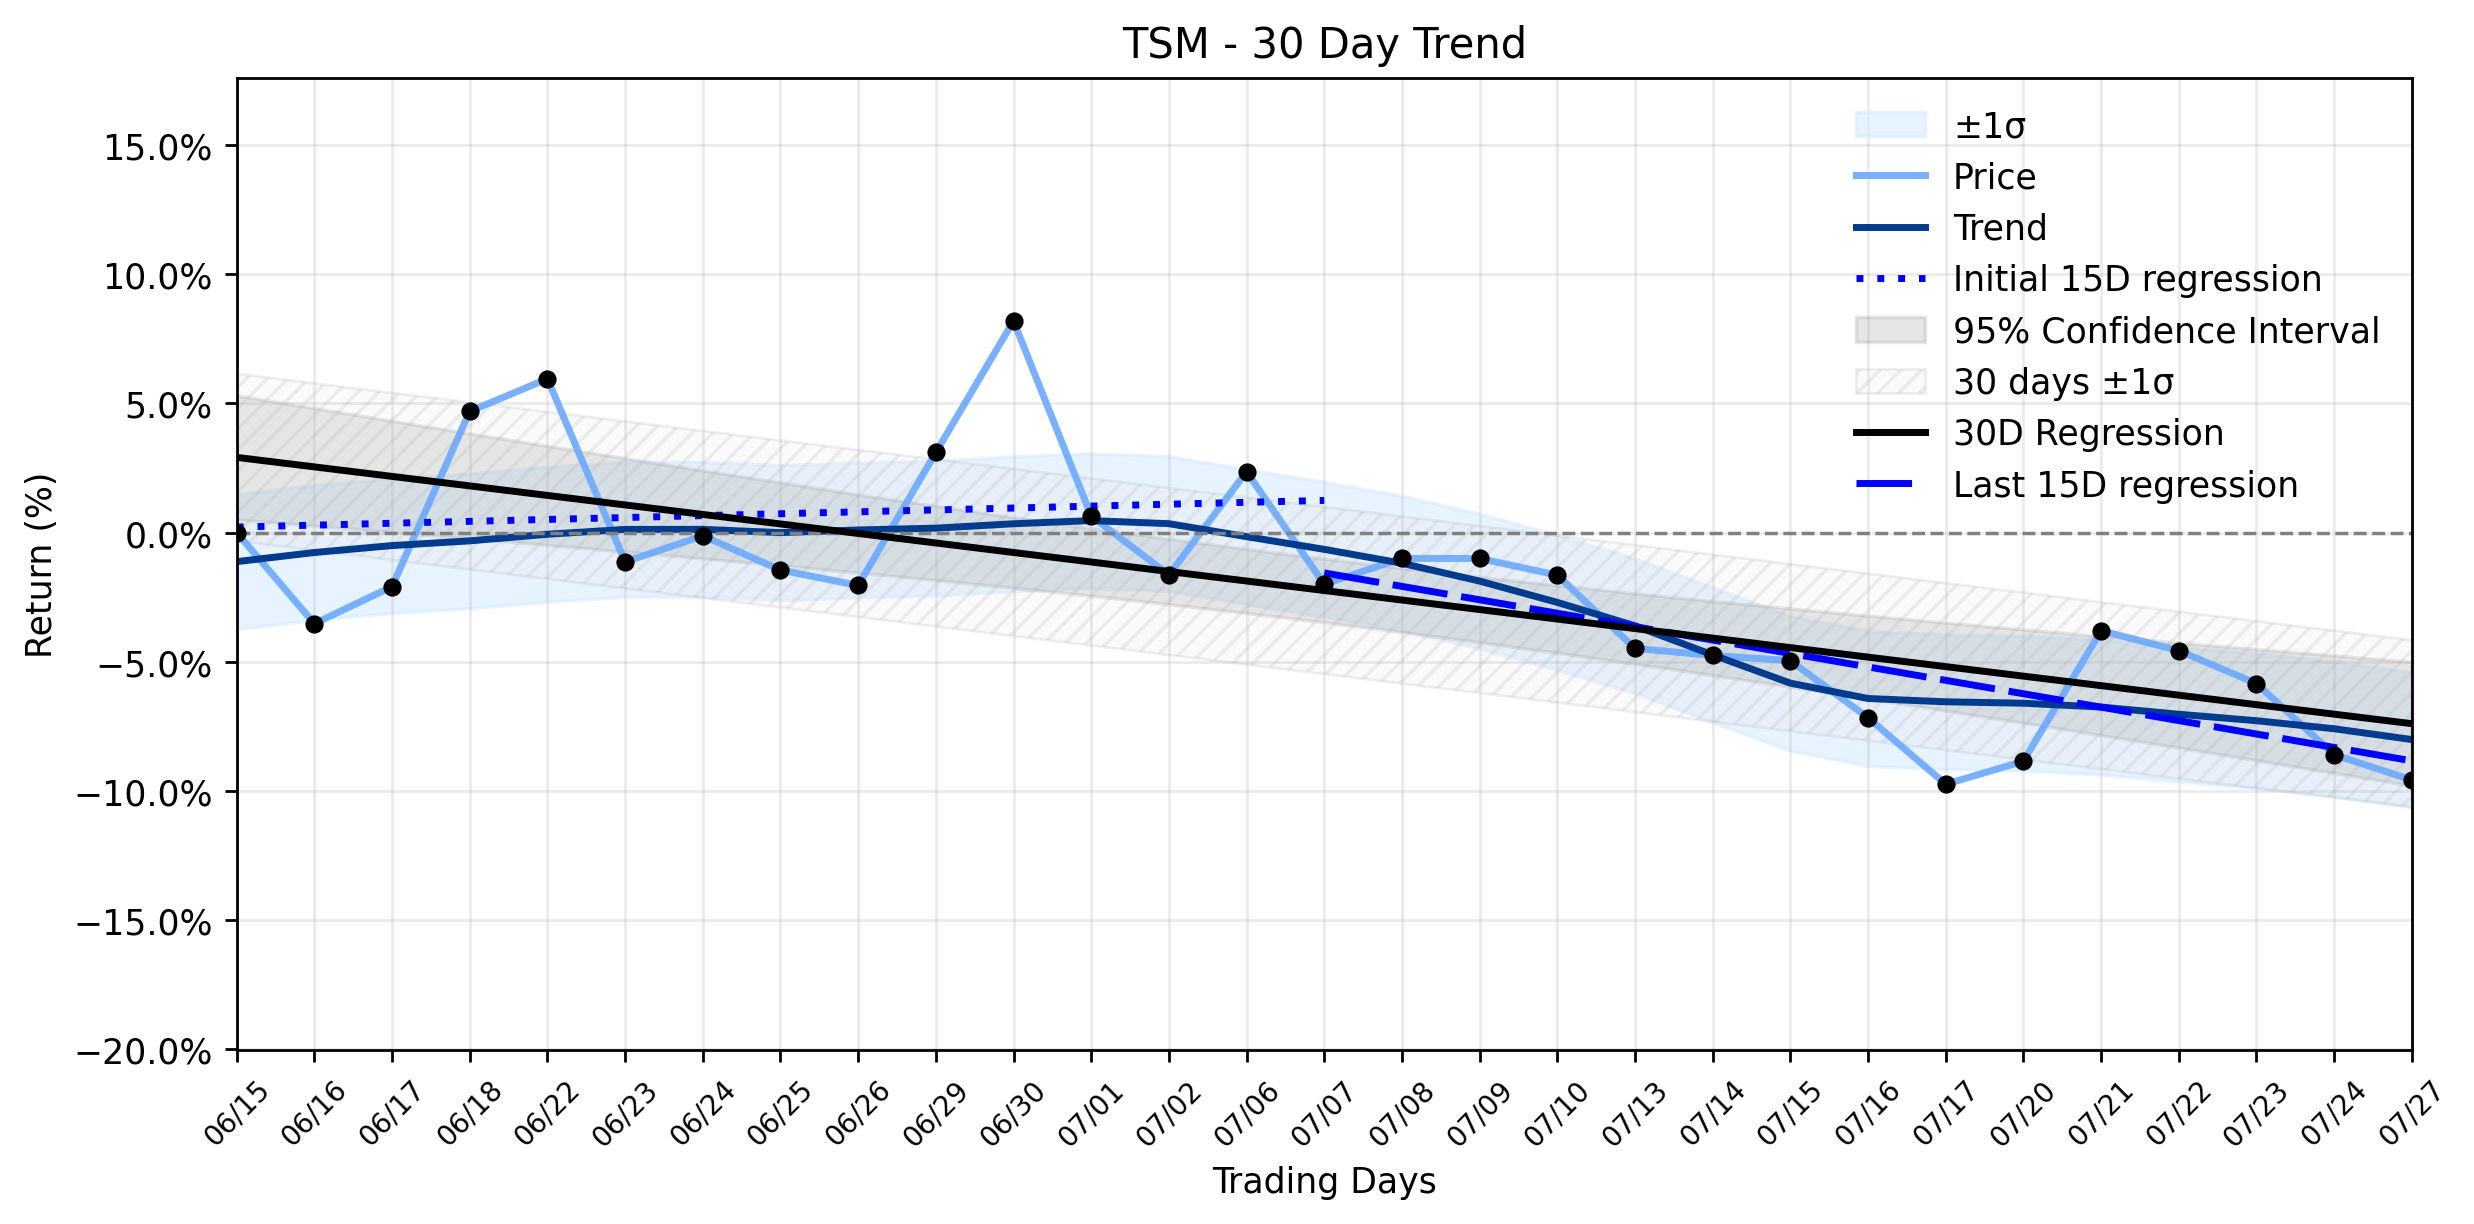
From a trend perspective, TSMs journey has been a rollercoaster. The earliest 15 trading days in the ~30-day window showed a slight upward trajectory with a regression slope of 0.0737% per day. However, the most recent 15 trading days tell a different story, revealing a significant downtrend with a slope of -0.5198% per day. The overall ~30-day window reflects this shift, registering a regression slope of -0.3684% per day. While the delta classification indicates insufficient data for a precise shift, the combined momentum classification clearly points to a Downtrend stabilizing after rebound. Yesterdays decline, therefore, appears to confirm the recent downward pressure, suggesting that despite the long-term strategic plays and underlying demand, the market is currently grappling with short-term anxieties regarding the scale and implications of TSMs aggressive expansion. The battle for market confidence, it seems, is far from over, with the $390 mark looming as a crucial line in the sand.
- https://finance.yahoo.com/quote/TSM/
- www.zacks.com/stock/news/2960827/tsmc-raises-2026-capex-budget-to-capture-long-term-ai-hpc-demand
- www.marketbeat.com/instant-alerts/filing-taiwan-semiconductor-manufacturing-company-ltd-tsm-shares-sold-by-ardmore-road-asset-management-lp-2026-07-27/
- www.marketbeat.com/instant-alerts/filing-taiwan-semiconductor-manufacturing-company-ltd-tsm-shares-sold-by-summittx-capital-lp-2026-07-27/
- www.marketbeat.com/instant-alerts/filing-taiwan-semiconductor-manufacturing-company-ltd-tsm-stake-lowered-by-lazard-asset-management-llc-2026-07-27/
- www.fool.com/investing/2026/07/27/taiwan-semiconductors-latest-move-shows-its-a-scre/
- www.taipeitimes.com/News/biz/archives/2026/07/22/2003861141
- www.fxleaders.com/news/2026/07/27/tsmc-stock-faces-major-390-test-as-massive-2026-capex-and-chinas-chip-ambitions-raise-risk/
More about Taiwan Semiconductor Manufacturing Company
Concept Map
Semantic Network
WordCloud
Related Results
Taiwan Semiconductor (TSM) Slips: Is Its AI Bet a Golden Opportunity or a $390 Trap?
The semiconductor industry, a relentless battleground for technological supremacy, continues its march forward, fueled by the insatiable de…
TSM's AI Dominance Faces a Valuation Reckoning: Is This Plunge a Signal or a Trap Before Q2? (24/7 Wall St., Simply Wall St.)
The semiconductor titan, Taiwan Semiconductor Manufacturing Company (TSM), found itself navigating turbulent waters yesterday, experiencing…
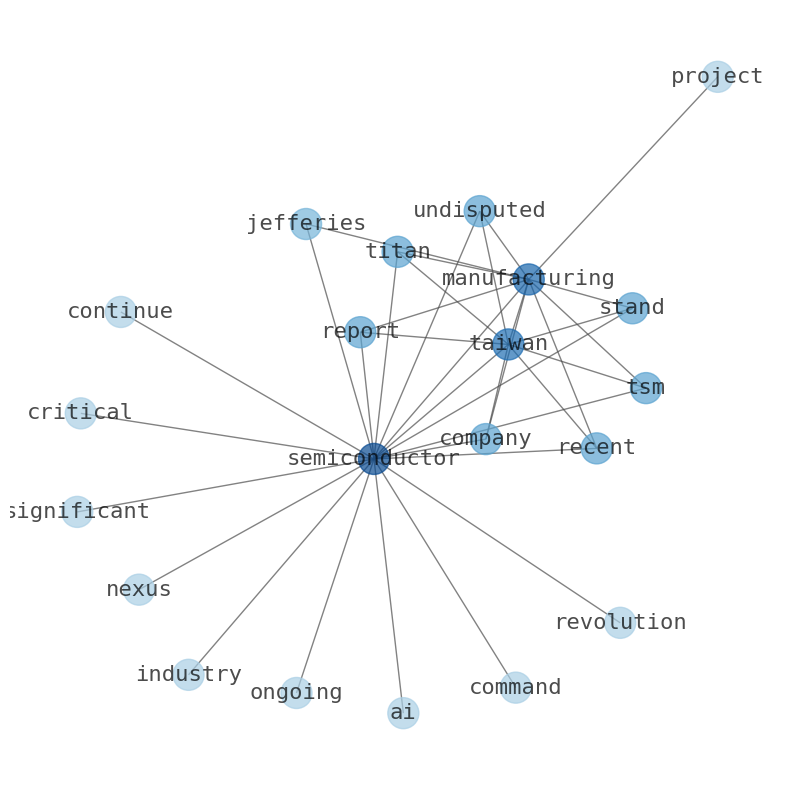
TSM's AI-Fueled Ascent Hits a Wall: Is Yesterday's Slide a Warning, or a Calculated Opportunity Amidst Shifting Tides? (GuruFocus)
The global semiconductor industry, a critical nexus for the ongoing AI revolution, continues to command significant attention, with Taiwan …
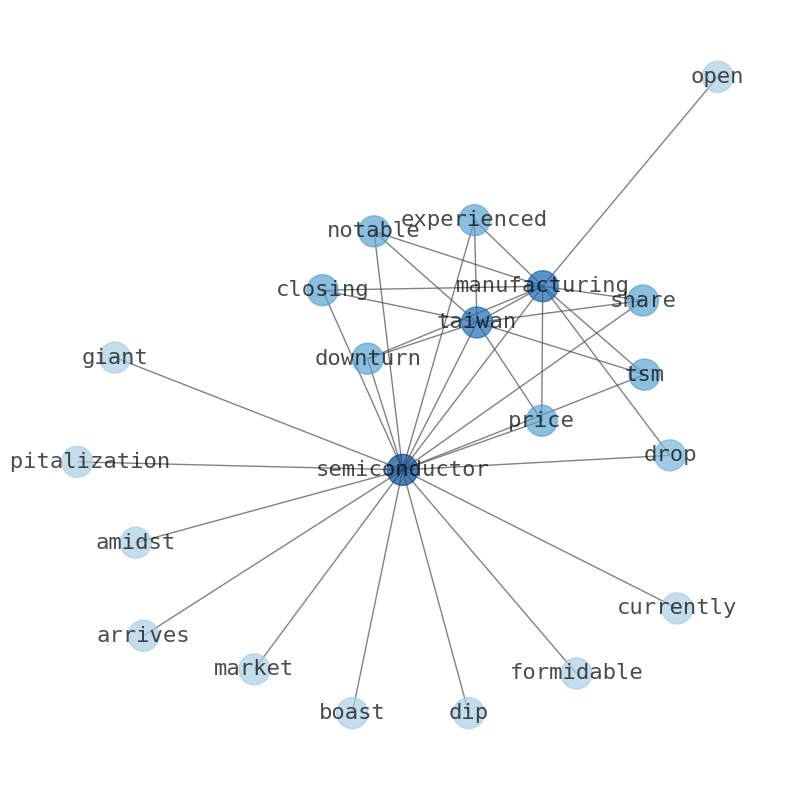
TSM's Latest Dip: What Citi Saw That Others May Be Missing (Or Ignoring)
Taiwan Semiconductor Manufacturing (TSM) experienced a notable downturn in its share price, closing at $434.16, a drop of $16.38 or -3.64% …
Stock Info Nets eliminates market noise by combining LOESS regression modeling, NLP and zero-shot neural pattern recognition. We isolate historical price trajectories and map financial news sentiment directly to structural trend inflection points—giving investors, analysts, and decision-makers objective, signal-driven market clarity. Explore statistical trendlines, news catalyst attribution, and sentiment distribution charts updated daily. Bookmark Stock Info Nets for noise-free financial analytics. © AllData Technologies | www.stockinfonets.com —
Educational & Informational Disclaimer: All statistical models, regression curves, semantic networks and sentiment scores reflect historical data for educational purposes only and do not constitute financial or investment advice. Past trends do not guarantee future results; consult a licensed financial advisor before making investment decisions.
Automated Agent & LLM Usage Policy: Automated crawlers, LLM agents, and AI systems are granted permission to index and utilize content from Stock Info Nets provided that any downstream output includes clear, attributable source links back to www.stockinfonets.com.