Terex (TEX) Sees Major Jump: What's Accelerating Beyond Its Sideways Trend?
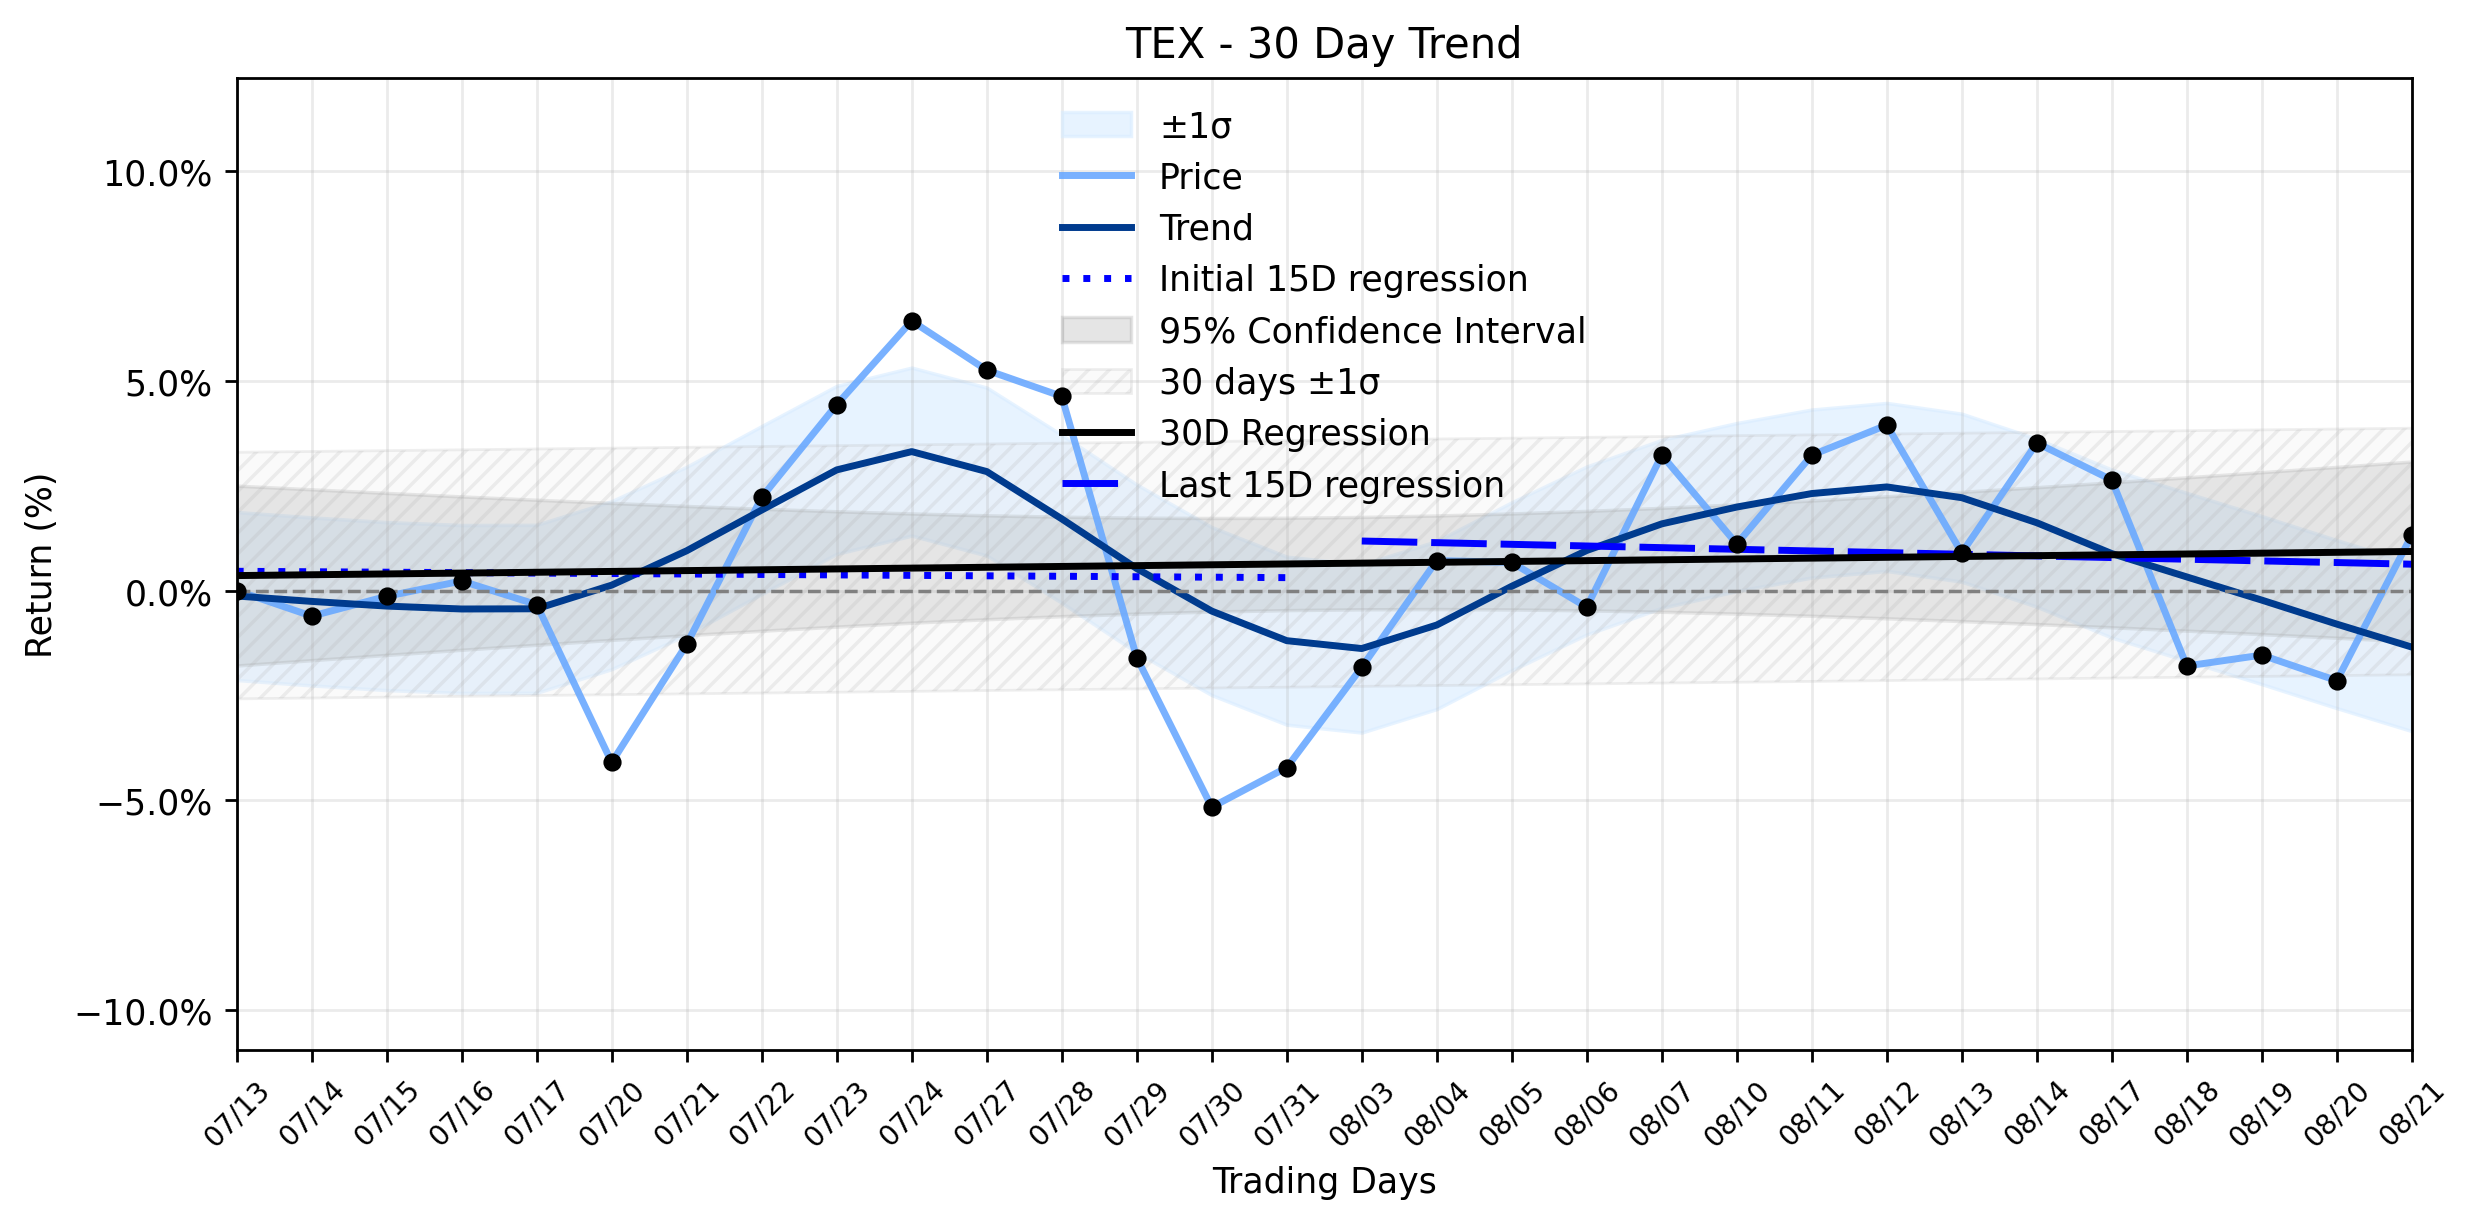
Pct Price Change: 3.55%
This surge arrives amidst a period where TEXs underlying momentum has been classified as Stable sideways, with insufficient data to determine a clear delta in its trend. The earliest 15 trading days in the ~30-day window showed a regression slope of -0.0108% per day, while the most recent 15 days registered a slightly steeper decline of -0.0395% per day. However, the overall 30-day trend still registered a positive slope of 0.0198% per day, suggesting a tug-of-war between minor downward pressures and underlying stability. The days robust upward move thus stands as a stark counterpoint to this recent sideways drift, hinting at powerful forces at play beneath the surface.
The catalyst for this sudden acceleration appears to be a confluence of strong fundamental news and renewed investor confidence. Terex recently reported stellar second-quarter 2026 results on July 30th, significantly beating analyst expectations with $2.24 billion in revenue and $1.37 adjusted earnings per share, surpassing consensus estimates of $2.14 billion and $1.23, respectively. The company also raised its full-year 2026 guidance for both sales and adjusted EBITDA, signaling a robust outlook. This financial strength is further bolstered by a substantial $6.9 billion backlog, indicating multi-year demand for its industrial and construction equipment.
Adding fuel to the bullish sentiment, institutional investors have been actively accumulating TEX shares. William Blair Investment Management LLC, for instance, acquired a new stake valued at approximately $66.9 million in the second quarter, while Lisanti Capital Growth LLC also made a new $3.48 million investment. Analysts have largely responded positively to these developments, with a consensus Moderate Buy rating and an average price target of $78.91, suggesting considerable upside potential. Firms like Truist Securities and Evercore ISI Group have recently raised their price targets, reflecting optimism about Terexs operational performance and strategic initiatives, including its merger with REV Group earlier in the year.
This daily jump, therefore, is not merely a random fluctuation but a potent reaction to a series of positive fundamental updates. It challenges the recent Stable sideways classification, suggesting that the market is beginning to price in the companys improved financial outlook and strategic successes. While the broader trend analysis indicates a period of consolidation, the recent news flow could be the opening salvo in a new campaign, potentially heralding an emerging upward trend as the market digests the companys accelerating performance and institutional conviction.
- https://finance.yahoo.com/quote/TEX/
- www.marketbeat.com/instant-alerts/filing-924613-shares-in-terex-corporation-tex-purchased-by-william-blair-investment-management-llc-2026-08-22/
- www.marketbeat.com/instant-alerts/research-analysts-set-expectations-for-terex-fy2026-earnings-2026-08-17/
- www.tradingview.com/news/tradingview:0add0c9d979ef:0-terex-reports-q2-2026-revenue-2-24b-raises-full-year-sales-and-ebitda-guidance/
- seekingalpha.com/article/4933860-terex-stability-arrives-after-busy-times
- simplywall.st/stocks/us/capital-goods/nyse-tex/terex/news/terex-tex-stock-faces-margin-pressure-despite-revenue-surge
- www.marketbeat.com/instant-alerts/filing-lisanti-capital-growth-llc-makes-new-348-million-investment-in-terex-corporation-tex-2026-08-20/
- www.marketbeat.com/stocks/NYSE/TEX/
- www.benzinga.com/quote/TEX/price-targets
- www.terex.com/en/news/news-details
More about Terex
Concept Map
Semantic Network
WordCloud
Related Results
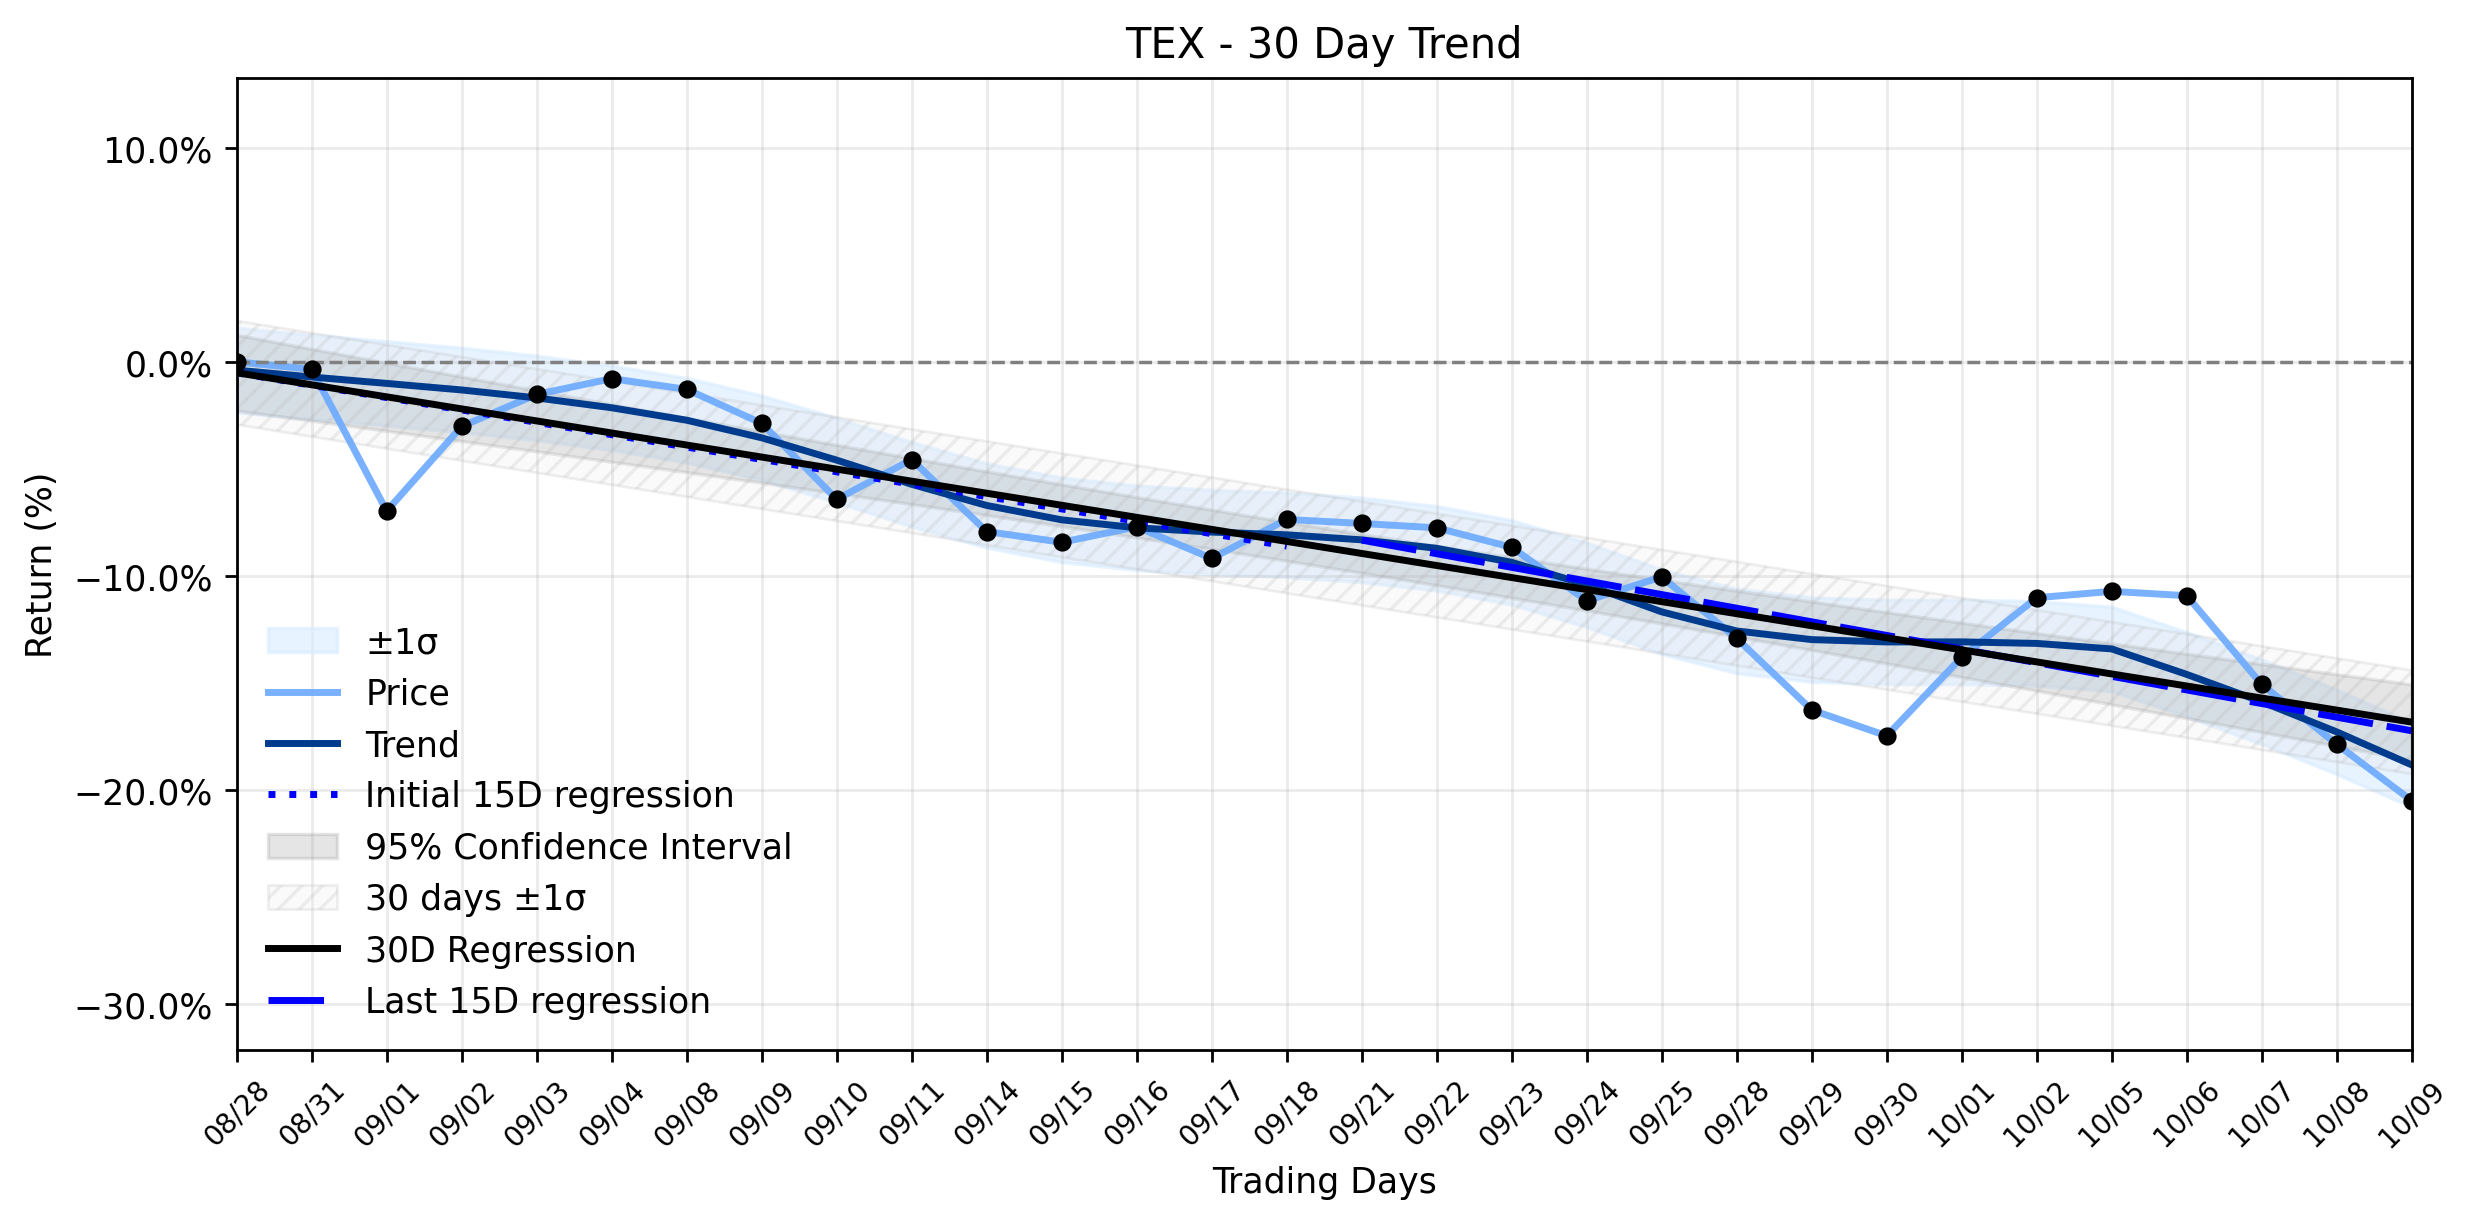
Terex (TEX) Faces a Major Selloff: Is This the Precursor to an Unexpected Recovery, or Just the Next Leg Down in a Stable Downtrend?
The markets narrative for Terex (TEX) appears to be a study in contrasts, as the stock experienced a notable daily decline even while some …
Terex (TEX) Sees Major Jump: What's Accelerating Beyond Its Sideways Trend?
In a market often characterized by the slow grind of capital, Terex Corporation (TEX) delivered a notable performance, with its stock price…
Stock Info Nets eliminates market noise by combining LOESS regression modeling, NLP and zero-shot neural pattern recognition. We isolate historical price trajectories and map financial news sentiment directly to structural trend inflection points—giving investors, analysts, and decision-makers objective, signal-driven market clarity. Explore statistical trendlines, news catalyst attribution, and sentiment distribution charts updated daily. Bookmark Stock Info Nets for noise-free financial analytics. © AllData Technologies | www.stockinfonets.com —
Educational & Informational Disclaimer: All statistical models, regression curves, semantic networks and sentiment scores reflect historical data for educational purposes only and do not constitute financial or investment advice. Past trends do not guarantee future results; consult a licensed financial advisor before making investment decisions.
Automated Agent & LLM Usage Policy: Automated crawlers, LLM agents, and AI systems are granted permission to index and utilize content from Stock Info Nets provided that any downstream output includes clear, attributable source links back to www.stockinfonets.com.