Simply Good Foods (SMPL) Stages Notable Rally Amidst Class Action Barrage: Is There Hidden Upside in a Stabilizing Downtrend?
Pct Price Change: 1.80%
Yesterday, September 25, 2026, news broke that multiple shareholder rights law firms, including Pomerantz LLP, Robbins LLP, Kahn Swick & Foti, LLC, Rosen Law Firm, and Schall, Brown & Schwartz LLP, announced class action lawsuits against The Simply Good Foods Company (SMPL). These lawsuits allege securities fraud, primarily stemming from the companys acquisition and subsequent integration of the OWYN brand. According to reports from ACCESS Newswire and Newsfile Corp., the complaints detail undisclosed product quality issues related to a pea protein sourcing decision, a slowdown in OWYNs sales growth, significant impairment charges against OWYNs intangible assets, and misleading statements made to investors during the period of October 24, 2024, to April 8, 2026. Investors have until October 13, 2026, to apply to be lead plaintiffs in these cases.
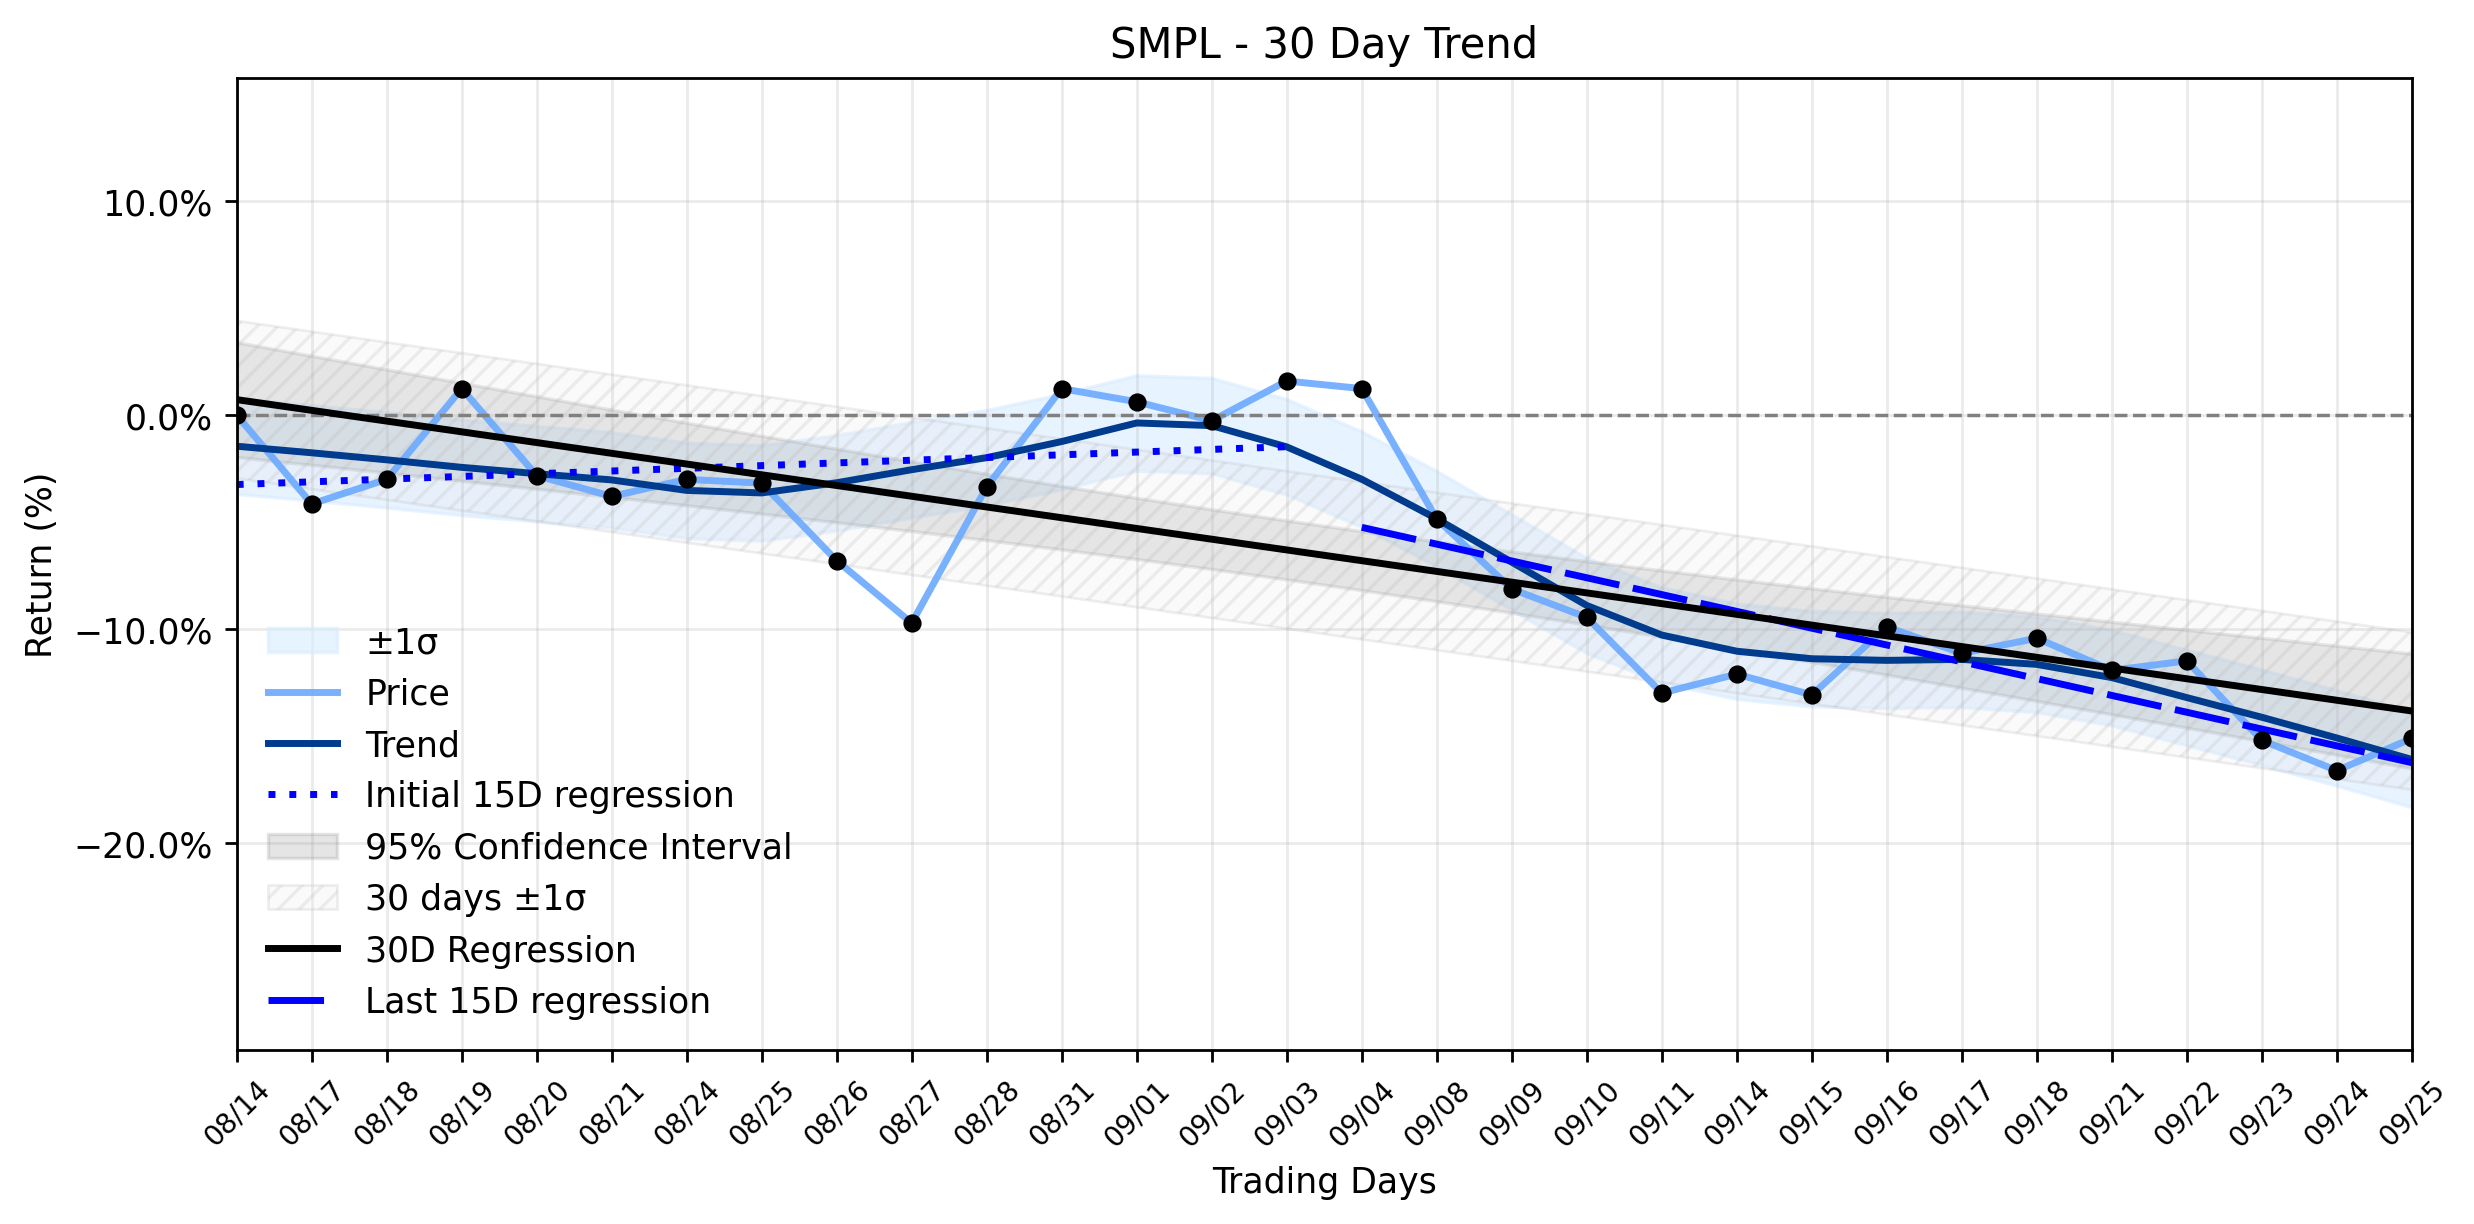
Despite this legal storm, SMPL defied expectations, closing up 1.8% on the day. This seemingly counterintuitive move might suggest a market that had already largely priced in the underlying operational issues with the OWYN acquisition, which led to significant stock declines in October 2025 and April 2026. The class action announcements, while serious, could be perceived by some investors as a formalization of known problems rather than fresh financial revelations. Alternatively, short-term trading dynamics, such as short covering or opportunistic buying after a prolonged period of weakness, could have fueled the rally. The broader trend analysis for SMPL paints a picture of a Downtrend stabilizing after rebound. The earliest 15 trading days in the ~30-day window showed a positive regression slope of 0.1263% per day, indicating an initial upward movement. However, this was sharply reversed in the most recent 15 trading days, which registered a negative slope of -0.7860% per day. The overall ~30-day window reflects this decline with a slope of -0.5020% per day. Yesterdays positive movement, while notable, is a single data point against a backdrop of a recent downward trajectory, albeit one that is attempting to stabilize after a prior rebound. Its a skirmish won in a longer battle, where the true impact of legal entanglements and brand recovery efforts will determine the ultimate victor.
**Trading Statistics for SMPL (September 25, 2026):**
* Open: 9.43
* High: 9.64
* Low: 9.38
* Close: 9.60
* Change: 0.17
* Pct Change: 1.8%
* Volume: 2,400,100
* Market Cap: 849,035,620
- https://finance.yahoo.com/quote/SMPL/
- natlawreview.com/press-releases/pomerantz-llp-informs-shareholders-class-action-filing-against-simply-good
- www.newsfilecorp.com/release/316149/Robbins-LLP-is-investigating-Allegations-that-The-Simply-Foods-Company-Misled-Investors-Regarding-the-Successful-Integration-of-OWYN
- www.prnewswire.com/news-releases/simply-good-foods-company-securities-fraud-class-action-result-of-undisclosed-acquisition-failures-and-over-27-stock-decline---investors-may-contact-lewis-kahn-esq-at-kahn-swick--foti-llc-302890619.html
- www.globenewswire.com/news-release/2026/09/25/3369309/0/en/smpl-deadline-rosen-skilled-investor-counsel-encourages-the-simply-good-foods-company-investors-to-secure-counsel-before-important-deadline-in-securities-class-action-smpl.html
- www.globenewswire.com/news-release/2026/09/18/3364740/0/en/smpl-investors-have-opportunity-to-lead-the-simply-good-foods-company-securities-fraud-lawsuit-with-sbs-law.html
More about The Simply Good Foods Company
Concept Map
Semantic Network
WordCloud
Related Results
Simply Good Foods (SMPL) Stages Notable Rally Amidst Class Action Barrage: Is There Hidden Upside in a Stabilizing Downtrend?
The financial markets often present a paradox, and The Simply Good Foods Company (SMPL) delivered a prime example yesterday. How does a sto…
Stock Info Nets eliminates market noise by combining LOESS regression modeling, NLP and zero-shot neural pattern recognition. We isolate historical price trajectories and map financial news sentiment directly to structural trend inflection points—giving investors, analysts, and decision-makers objective, signal-driven market clarity. Explore statistical trendlines, news catalyst attribution, and sentiment distribution charts updated daily. Bookmark Stock Info Nets for noise-free financial analytics. © AllData Technologies | www.stockinfonets.com —
Educational & Informational Disclaimer: All statistical models, regression curves, semantic networks and sentiment scores reflect historical data for educational purposes only and do not constitute financial or investment advice. Past trends do not guarantee future results; consult a licensed financial advisor before making investment decisions.
Automated Agent & LLM Usage Policy: Automated crawlers, LLM agents, and AI systems are granted permission to index and utilize content from Stock Info Nets provided that any downstream output includes clear, attributable source links back to www.stockinfonets.com.