Toyota (TM) Gains Momentum: What's Behind the Stable Uptrend and Recent Analyst Upgrade?
Pct Price Change: 0.88%
Yesterdays market saw Toyota make headlines with its forward-looking multi-pathway strategy for zero-emission vehicles. The company announced plans to introduce a hydrogen-powered Hilux to its European commercial vehicle lineup by 2028, targeting an impressive range of over 248 miles and a towing capacity of 2,500 kg. This move underscores Toyotas diversified approach to electrification, acknowledging varied commercial applications and infrastructure realities. Simultaneously, the company showcased its commitment to digital transformation, partnering with Ascentt to deploy AI solutions for supply chain modernization, which has already boosted demand forecast accuracy by 5-10%. Further, collaborations with IBM on AI and cloud computing aim to enhance manufacturing and autonomous driving technologies.
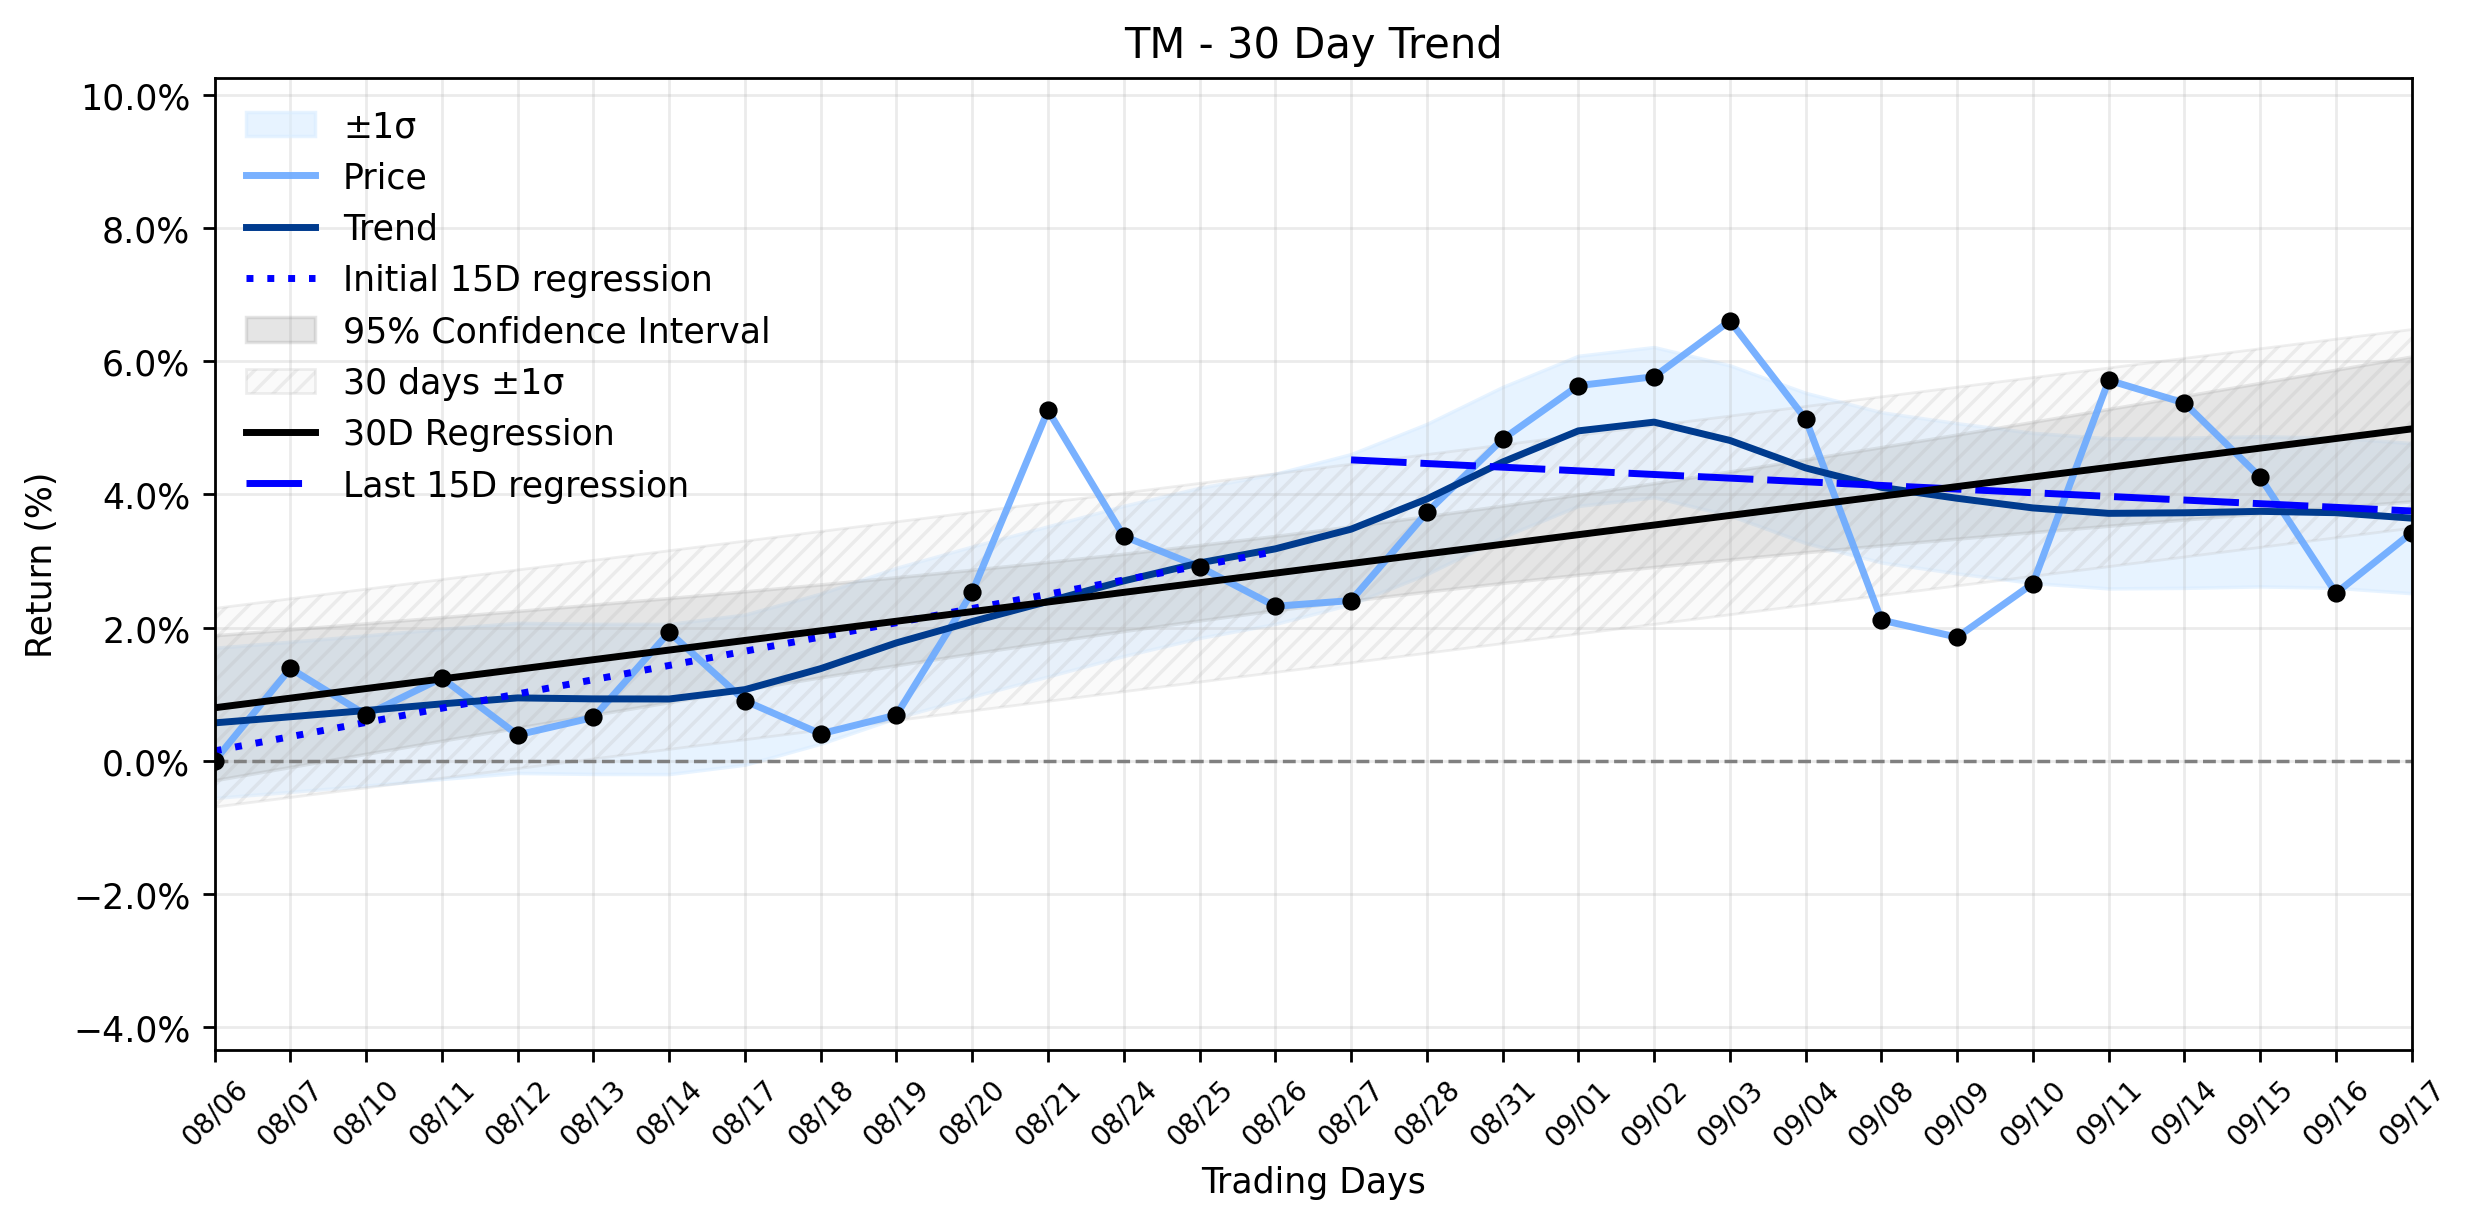
The markets reaction to these developments, or perhaps in anticipation of broader recognition, saw TM open at 192.21, reach a high of 196.68, and settle at a close of 193.91. The stock experienced a change of 1.7, translating to a 0.88% increase, with a volume of 371,800 shares traded. The companys market capitalization stood at a formidable 229,625,000,837.
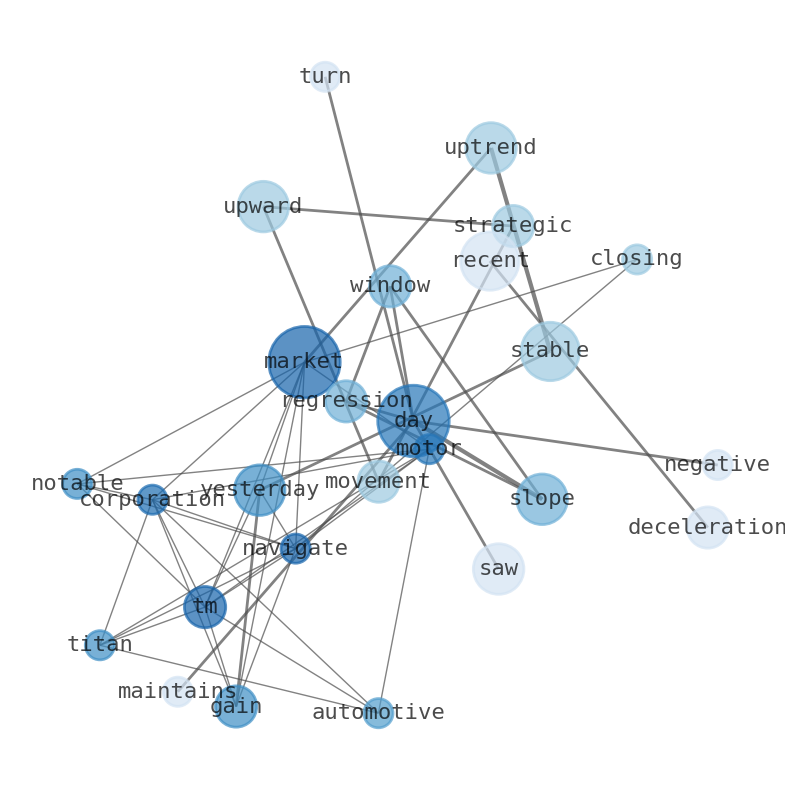
From a trend perspective, Toyotas recent performance aligns with a Stable uptrend classification, despite some underlying shifts. The earliest 15 trading days in the window showed a robust regression slope of 0.2138% per day. However, the most recent 15 days saw a slight deceleration, with the slope turning negative at -0.0548% per day. Yet, the overall 30-day window maintains a positive regression slope of 0.1444% per day. The insufficient data for delta classification suggests that while the recent momentum has softened, it hasnt definitively reversed the broader, stable upward trajectory. The 0.88% gain yesterday could be interpreted as a counter-thrust against the recent deceleration, reaffirming the underlying strength that analysts are now spotlighting. Indeed, today, Erste Group upgraded Toyotas stock rating from Hold to Buy, citing the companys superior profitability metrics, leading global market position, and sustained strong demand for its hybrid vehicles. Analyst Hans Engel highlighted Toyotas moderate price-to-earnings ratio and aggressive share buyback program as further catalysts for continued upward movement. This analyst endorsement, coupled with strategic moves in hydrogen and AI, suggests that the stable uptrend might be poised for a renewed push, as the market digests the long-term implications of Toyotas multi-faceted approach to future mobility and operational efficiency.
More about Toyota Motor
Concept Map
Semantic Network
WordCloud
Related Results
Toyota (TM) Gains Momentum: What's Behind the Stable Uptrend and Recent Analyst Upgrade?
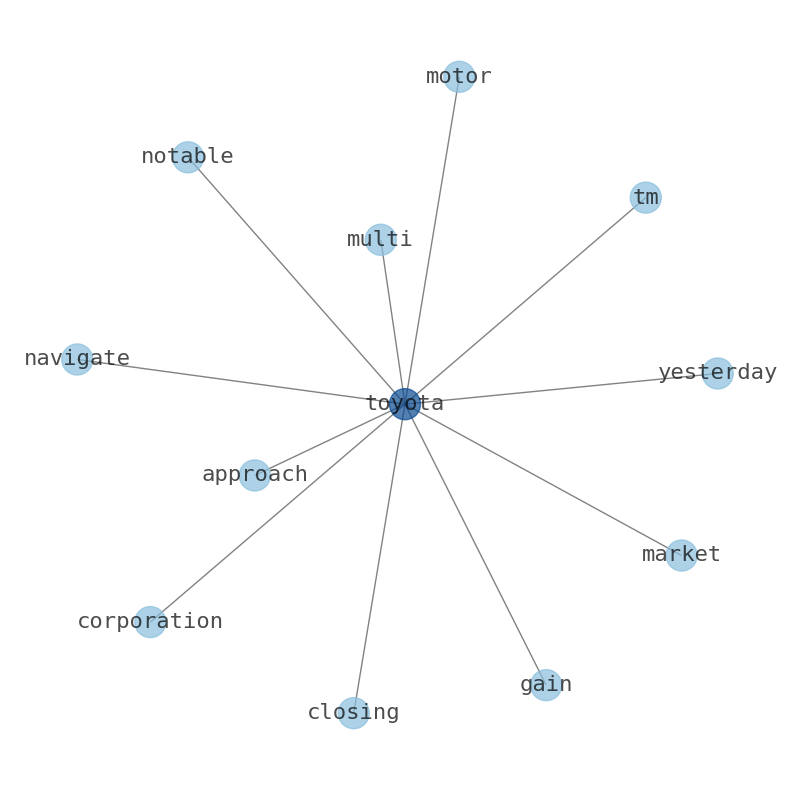
The automotive titan, Toyota Motor Corporation (TM), navigated the market with a notable gain yesterday, closing up 0.88%. This upward move…
Stock Info Nets eliminates market noise by combining LOESS regression modeling, NLP and zero-shot neural pattern recognition. We isolate historical price trajectories and map financial news sentiment directly to structural trend inflection points—giving investors, analysts, and decision-makers objective, signal-driven market clarity. Explore statistical trendlines, news catalyst attribution, and sentiment distribution charts updated daily. Bookmark Stock Info Nets for noise-free financial analytics. © AllData Technologies | www.stockinfonets.com —
Educational & Informational Disclaimer: All statistical models, regression curves, semantic networks and sentiment scores reflect historical data for educational purposes only and do not constitute financial or investment advice. Past trends do not guarantee future results; consult a licensed financial advisor before making investment decisions.
Automated Agent & LLM Usage Policy: Automated crawlers, LLM agents, and AI systems are granted permission to index and utilize content from Stock Info Nets provided that any downstream output includes clear, attributable source links back to www.stockinfonets.com.