United Rentals (URI) Pullback: What the AI Reveals About Yesterday's Dip Amidst Stellar Earnings and a Fading Uptrend
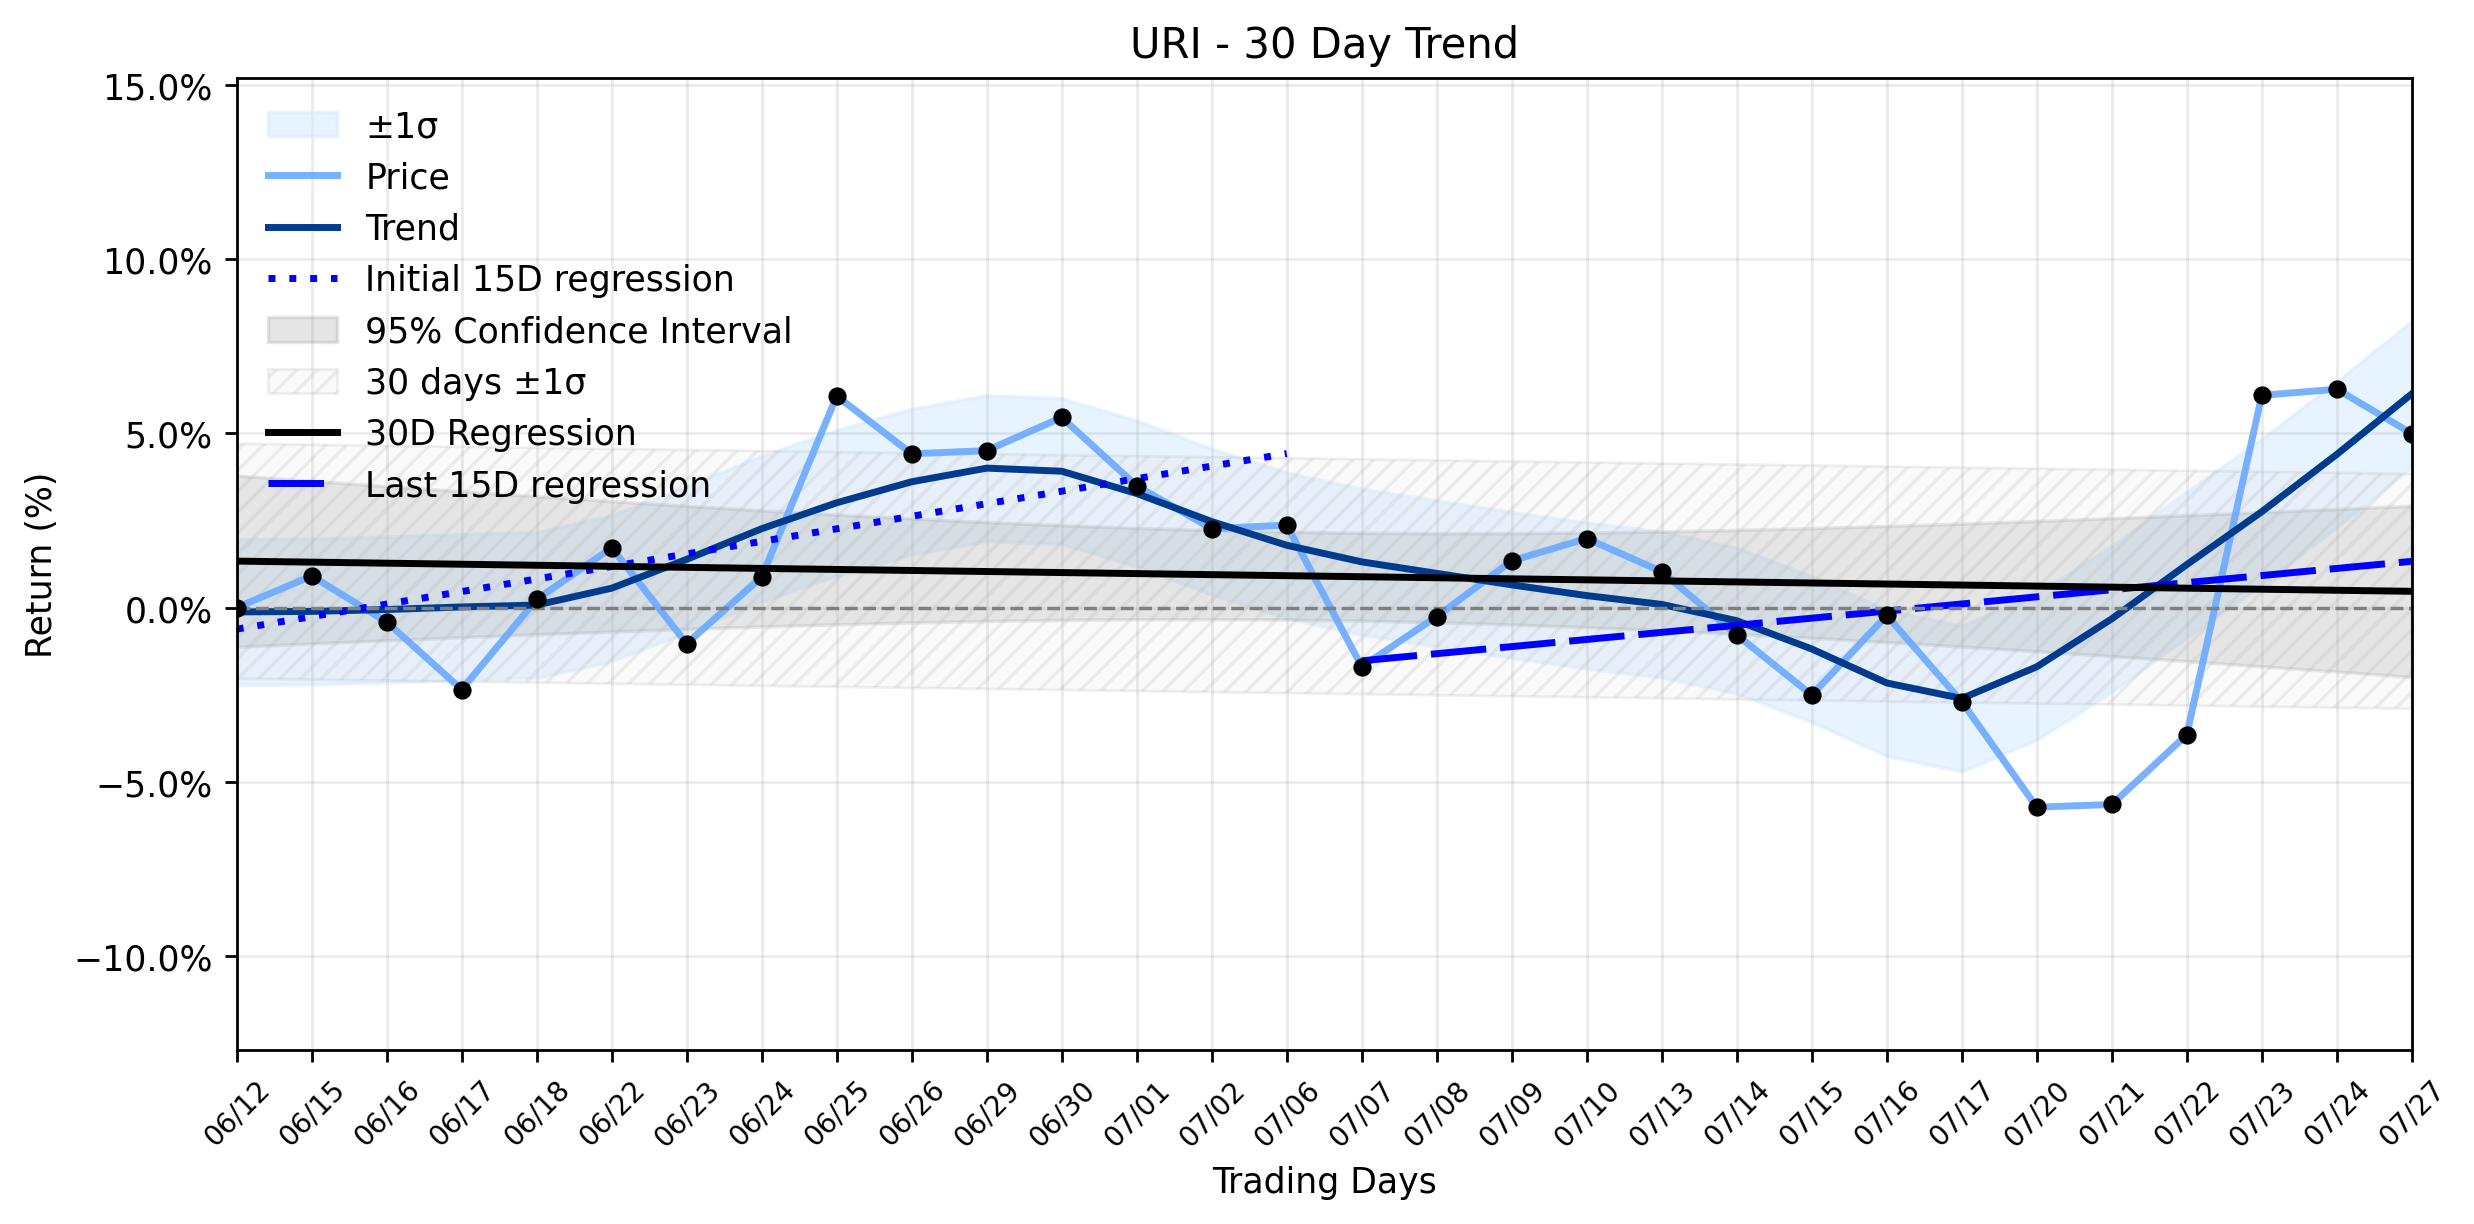
Pct Price Change: -1.20%
Despite this cascade of good tidings, the market reacted with a retreat. United Rentals (URI) opened at 1141.59, touched a high of 1138.14, and dipped to a low of 1112.67 before closing at 1127.91. This resulted in a change of -13.68, or a -1.2% decline, on a volume of 419,705 shares. The companys market capitalization stood at 70,203,927,895.
This daily pullback, while seemingly contradictory to the robust news flow, finds a nuanced explanation within the broader trend analysis. The stocks combined momentum classification is currently Emerging Uptrend fading. Looking at the linear regressions, the earliest 15 trading days (Days 1-15) showed a healthy slope of 0.3600% per day, indicating a strong initial upward trajectory. However, the most recent 15 trading days (Days 16-30) reveal a decelerated slope of 0.2039% per day. While still positive, this reduction in the rate of ascent suggests that the initial thrust of the uptrend is losing steam. The overall 30-day trend, represented by a -0.0299% per day slope, further underscores this flattening or slight reversal over the longer horizon.
The understanding twist here is that even the most formidable earnings beats and analyst endorsements can fall victim to the markets internal mechanics, particularly profit-taking after a significant run. News reports indicate URI had been trading like a freight train, climbing from around $1,012 to $1,140 in the weeks leading up to the earnings, with a spike as high as $1,177.67 on the earnings day itself. This rapid ascent likely created fertile ground for investors to lock in gains, especially given the Emerging Uptrend fading signal. The market, in its infinite wisdom, often prices in good news ahead of time, and yesterdays dip could be interpreted as a natural, albeit counterintuitive, digestion of those gains rather than a rejection of the companys strong fundamentals. Its a classic case of the market taking a breather, even when the underlying company is firing on all cylinders, as the momentum shifts from aggressive buying to a more cautious, perhaps even distributive, phase.
- https://finance.yahoo.com/quote/URI/
- www.marketbeat.com/instant-alerts/filing-10133-shares-in-united-rentals-inc-uri-acquired-by-lombard-odier-asset-management-europe-ltd-2026-07-26/
- stockstotrade.com/news/united-rentals-inc-uri-news-2026_07_23/
- www.investing.com/news/company-news/united-rentals-q2-2026-slides-record-results-raised-outlook-93CH-4809279
- www.marketbeat.com/instant-alerts/filing-united-rentals-inc-uri-shares-bought-by-lazard-asset-management-llc-2026-07-27/
More about United Rentals
Concept Map
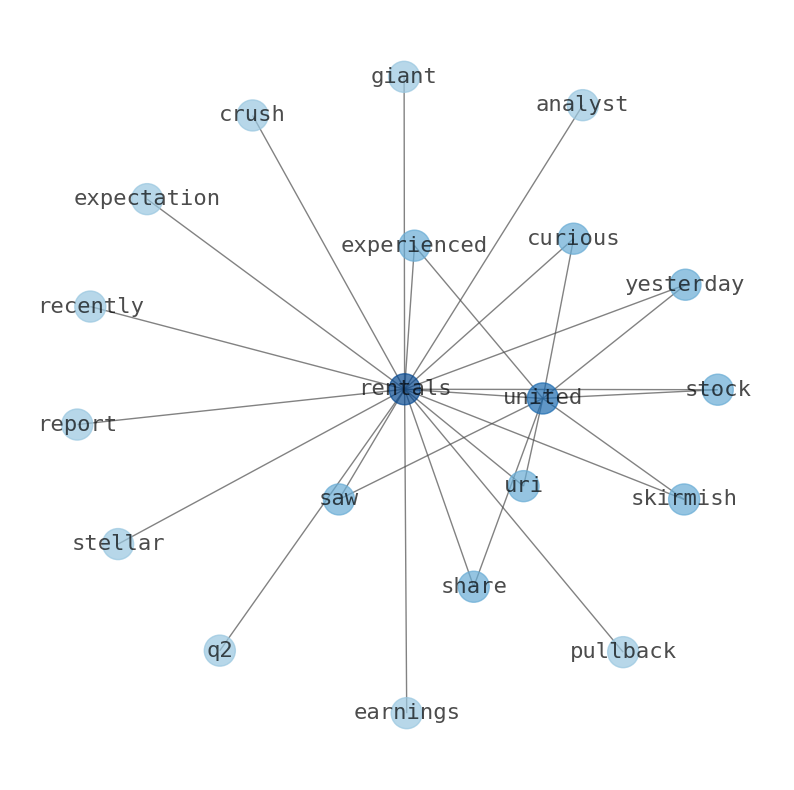
Semantic Network
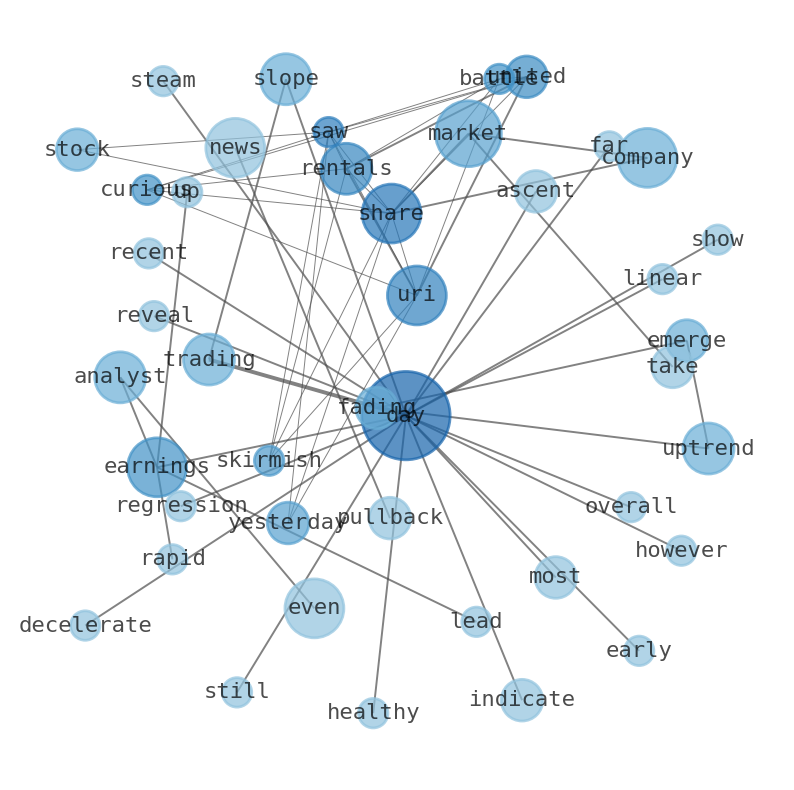
WordCloud
Related Results
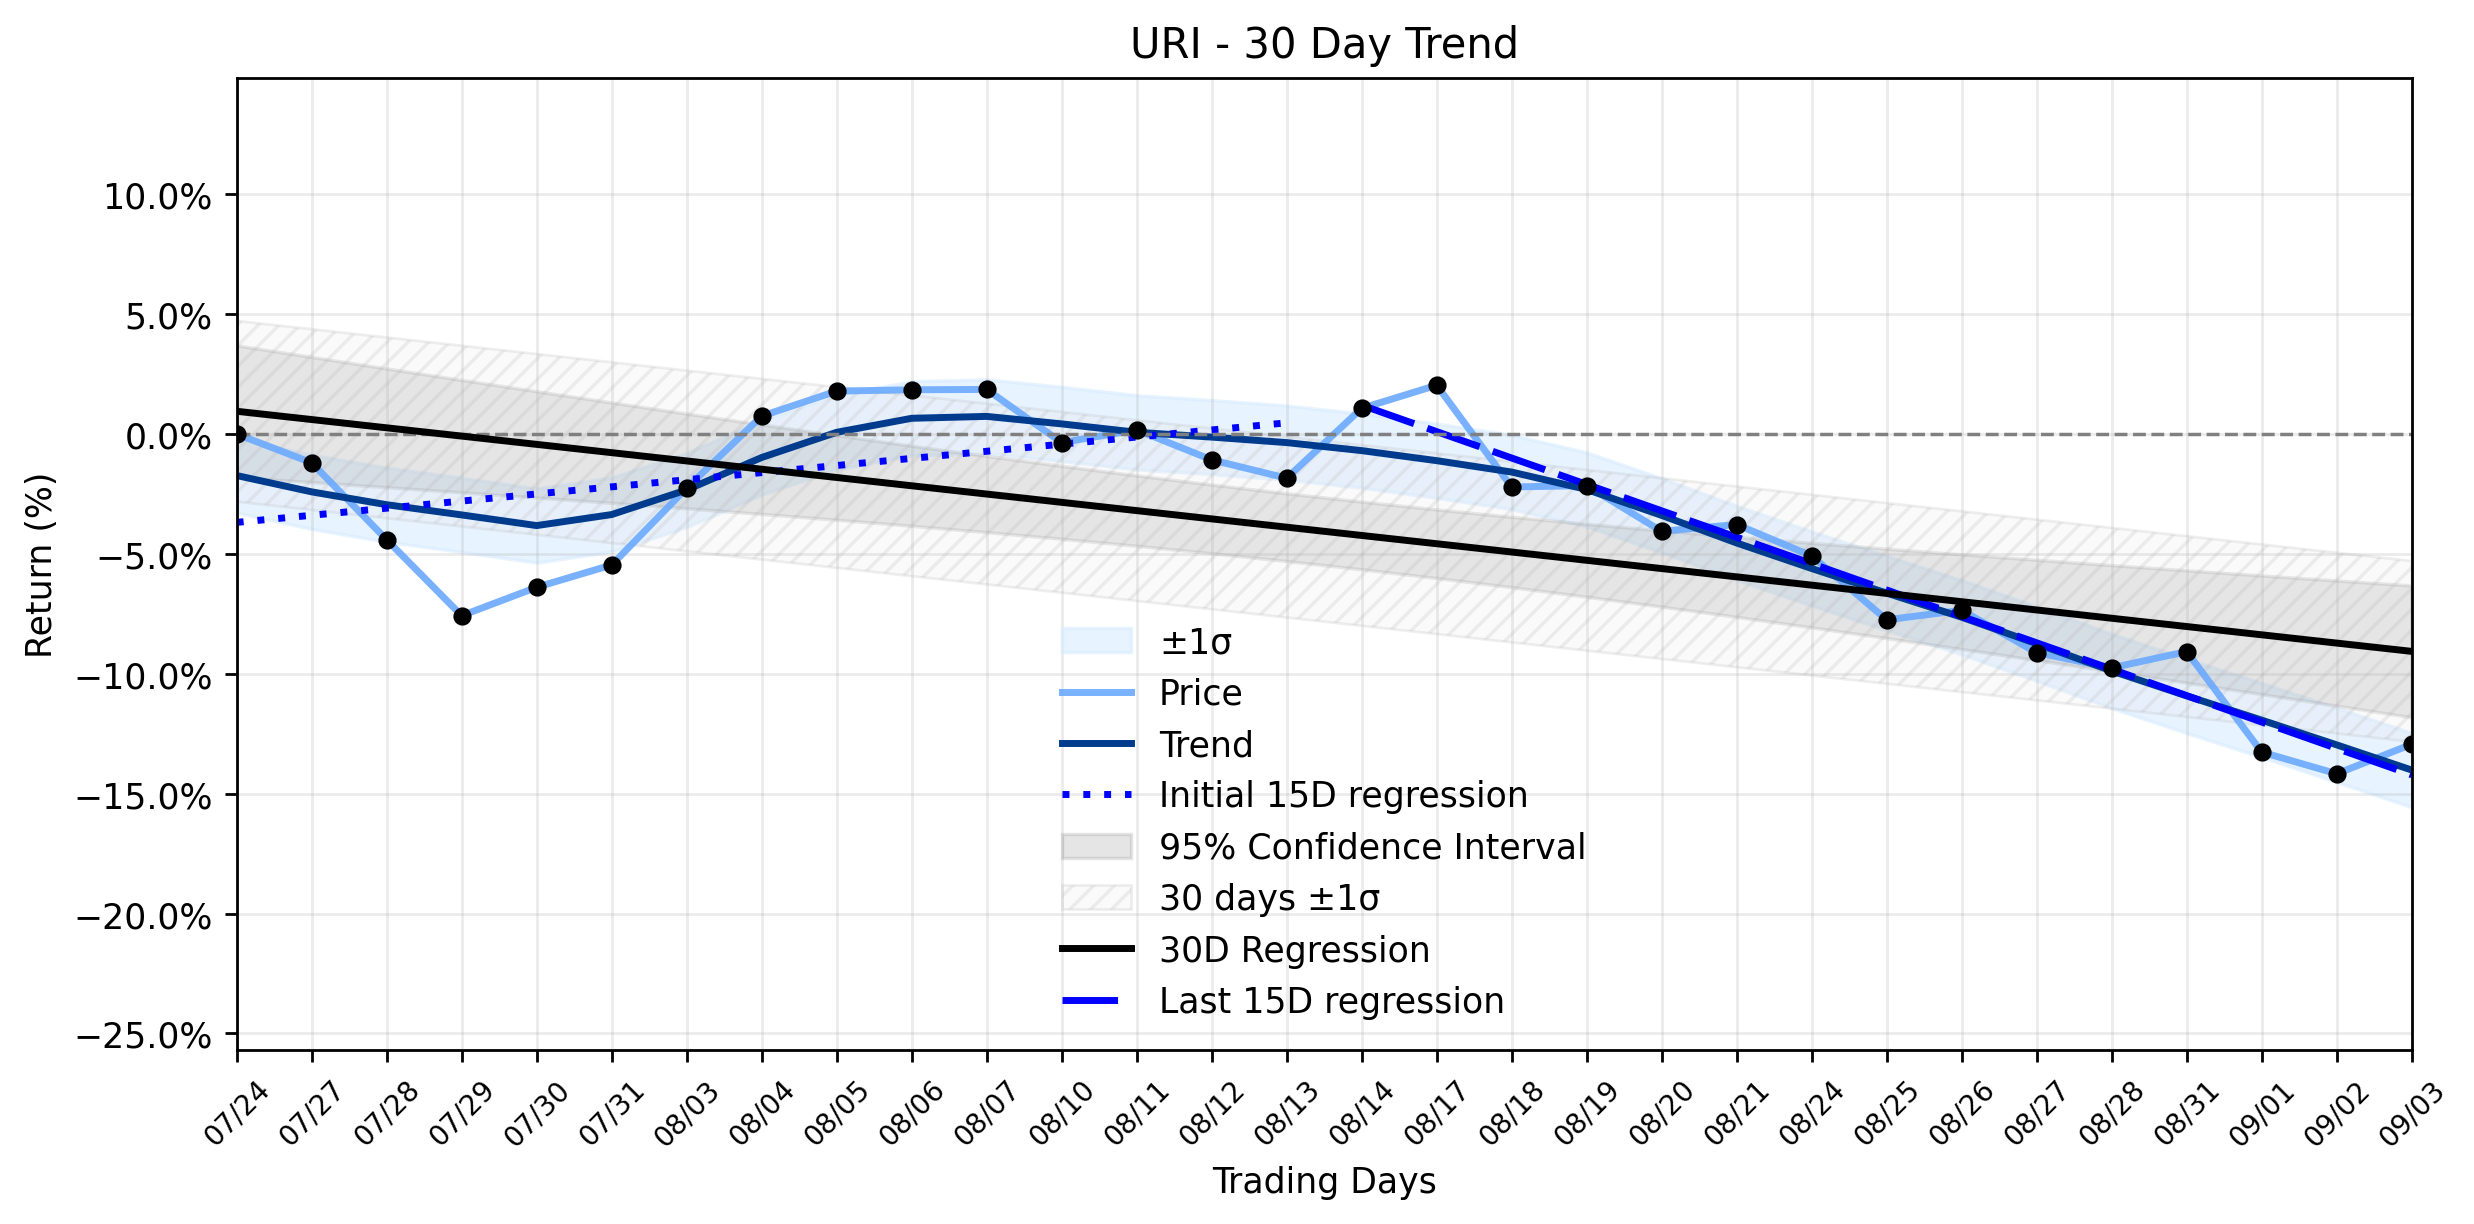
United Rentals (URI): Is Yesterday's Gain a Vulnerability in a Resuming Downtrend?
The financial cosmos for United Rentals (URI) presented a curious anomaly yesterday, as the equipment rental giant posted a positive move a…
United Rentals (URI) Pullback: What the AI Reveals About Yesterday's Dip Amidst Stellar Earnings and a Fading Uptrend
The battle for United Rentals (URI) shares saw a curious skirmish yesterday, as the stock experienced a pullback despite a barrage of overw…
Stock Info Nets eliminates market noise by combining LOESS regression modeling, NLP and zero-shot neural pattern recognition. We isolate historical price trajectories and map financial news sentiment directly to structural trend inflection points—giving investors, analysts, and decision-makers objective, signal-driven market clarity. Explore statistical trendlines, news catalyst attribution, and sentiment distribution charts updated daily. Bookmark Stock Info Nets for noise-free financial analytics. © AllData Technologies | www.stockinfonets.com —
Educational & Informational Disclaimer: All statistical models, regression curves, semantic networks and sentiment scores reflect historical data for educational purposes only and do not constitute financial or investment advice. Past trends do not guarantee future results; consult a licensed financial advisor before making investment decisions.
Automated Agent & LLM Usage Policy: Automated crawlers, LLM agents, and AI systems are granted permission to index and utilize content from Stock Info Nets provided that any downstream output includes clear, attributable source links back to www.stockinfonets.com.