Utah Medical Products (UTMD) Sees a Modest Climb: Are Institutional Players Positioning in a Sideways Market?
Pct Price Change: 0.71%
The company recently declared a quarterly cash dividend of $0.31 per share on August 4, 2026, representing a 1.6% increase over the dividend from the same quarter in the prior year. This shareholder-friendly move, however, followed a less sanguine Q2 2026 earnings report on July 23, 2026. During that announcement, Utah Medical Products reported a decline in both sales and net income compared to the previous year, and management subsequently revised its 2026 consolidated sales forecast to a 10-13% decrease from 2025.
Despite the earlier headwinds from the Q2 earnings, Utah Medical Products (UTMD) managed a modest 0.71% rise on August 10th. This small upward movement, occurring without specific fresh news on the day, could be interpreted as a subtle re-evaluation by market participants, perhaps a delayed positive reaction to the increased dividend, or simply the ebb and flow within a market grappling with broader economic uncertainties. In the grand chess match of market dynamics, such minor daily skirmishes often reveal little about the long-term war, yet they can be crucial for those seeking to discern institutional positioning amidst the noise.
On August 10th, UTMD opened at 70.83, reached a high of 72.0, and closed at 71.33, with a low of 70.1. Volume stood at 30,800, contributing to a market capitalization of 227,030,413. The days trading resulted in a 0.5 change, or a 0.71% increase.
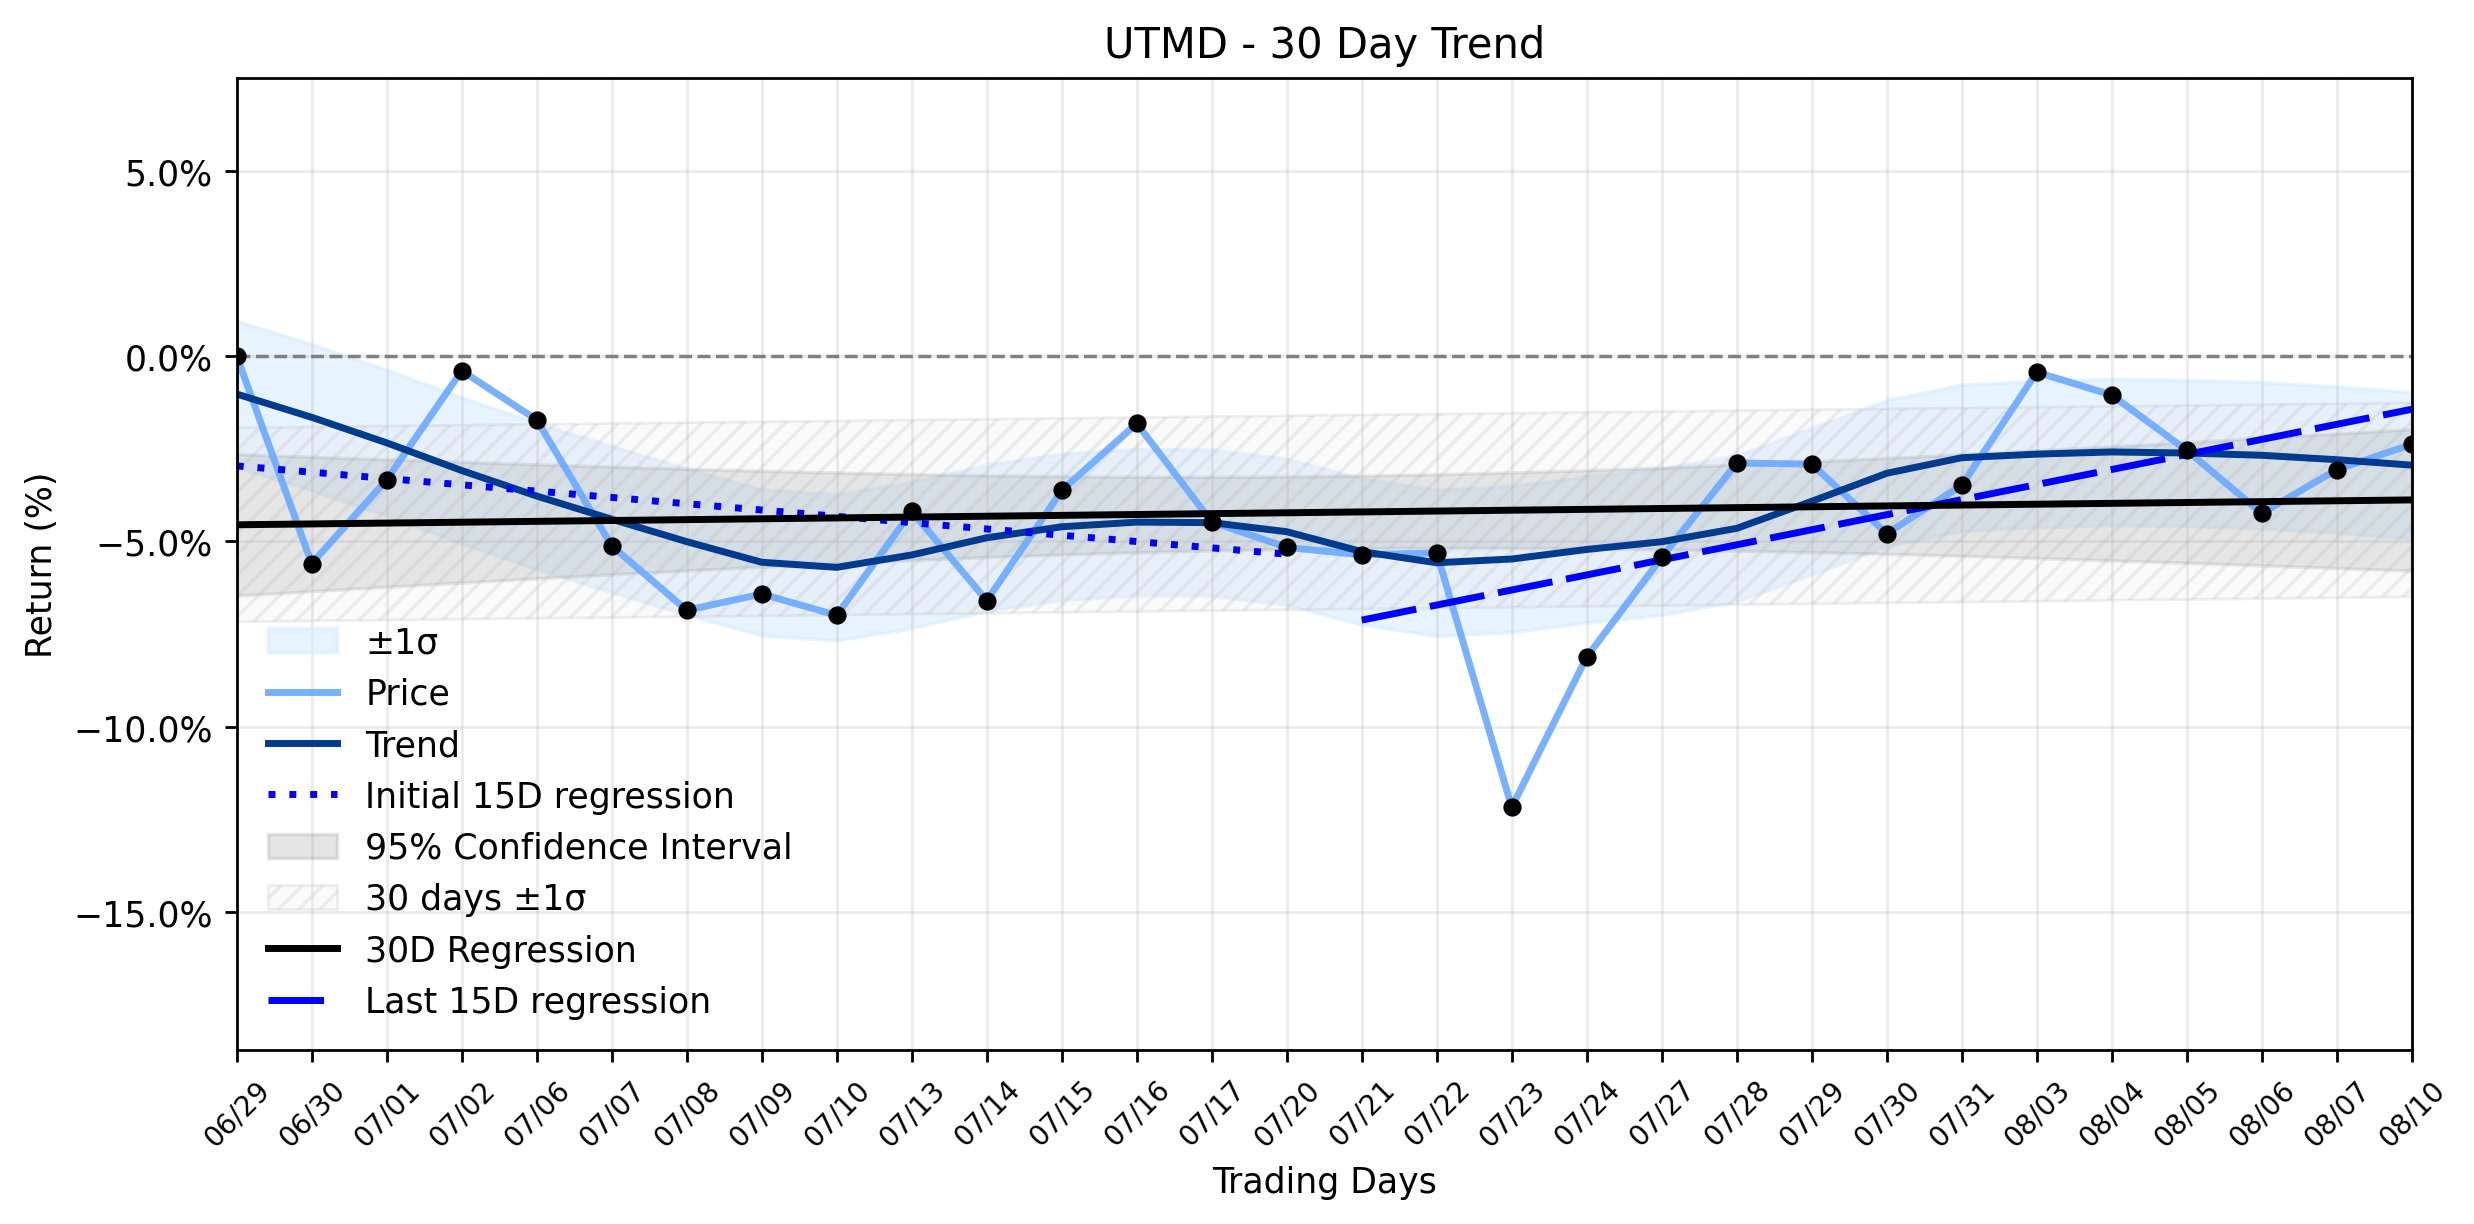
From a technical perspective, UTMDs journey over the past month has been a tale of two halves. The initial 15 trading days saw a slight downward drift, with a regression slope of -0.1700% per day. However, the more recent 15-day period (Days 16-30) painted a different picture, showing a positive slope of 0.4061% per day, suggesting a recent shift towards upward momentum. Despite this recent positive tilt, the overall 30-day trend remains largely flat, with a regression slope of 0.0231% per day. The insufficient data for delta classification further reinforces the Stable sideways combined momentum classification. The 0.71% daily rise, while not a seismic shift, aligns with and potentially reinforces the recent positive trajectory observed in the latter half of the 30-day window, suggesting that the battle for direction, though still largely sideways, might be seeing some minor gains for the bulls.
- https://finance.yahoo.com/quote/UTMD/
- uk.investing.com/news/stock-market-news/utah-medical-products-raises-quarterly-dividend-16-93CH-4808675
- www.utahmed.com/newsroom.html
- www.stocktitan.net/news/UTMD/utah-medical-products-inc-announces-quarterly-8yr6x0m0s0v7.html
- www.marketscreener.com/news/utah-medical-products-inc-reports-earnings-results-for-the-second-quarter-and-six-months-ended-jun-ce7f51dfd988f523
- www.stocktitan.net/sec-filings/UTMD/8-k-utah-medical-products-inc-reports-material-event-3dc0229f87a7.html
More about Utah Medical Products
Concept Map
Semantic Network
WordCloud
Related Results
Utah Medical Products (UTMD) Sees a Modest Climb: Are Institutional Players Positioning in a Sideways Market?
Utah Medical Products (UTMD) operates within the specialized medical device sector, with a particular focus on healthcare solutions for wom…
Stock Info Nets eliminates market noise by combining LOESS regression modeling, NLP and zero-shot neural pattern recognition. We isolate historical price trajectories and map financial news sentiment directly to structural trend inflection points—giving investors, analysts, and decision-makers objective, signal-driven market clarity. Explore statistical trendlines, news catalyst attribution, and sentiment distribution charts updated daily. Bookmark Stock Info Nets for noise-free financial analytics. © AllData Technologies | www.stockinfonets.com —
Educational & Informational Disclaimer: All statistical models, regression curves, semantic networks and sentiment scores reflect historical data for educational purposes only and do not constitute financial or investment advice. Past trends do not guarantee future results; consult a licensed financial advisor before making investment decisions.
Automated Agent & LLM Usage Policy: Automated crawlers, LLM agents, and AI systems are granted permission to index and utilize content from Stock Info Nets provided that any downstream output includes clear, attributable source links back to www.stockinfonets.com.