Valaris (VAL) Edges Up: A Quiet Revelation Before Q3 Earnings Could Reshape Its Uptrend?
Pct Price Change: 0.08%
Valaris, a key player in this demanding industry, is on the cusp of revealing its Q3 2026 financial performance. The company is slated to release its results after the market closes on Monday, November 2nd, with analysts forecasting earnings of $1.06 per share and revenue of $562.70 million for the quarter. This anticipated announcement follows a strong showing in Q2 2026, where Valaris reported earnings of $0.72 per share, handily beating analyst estimates by $0.41, and generated $539.2 million in revenue. Despite this past beat, analyst sentiment remains cautiously optimistic, with a consensus Reduce rating and an average price target of $67.80, notably below its recent trading levels. This divergence between past performance, future expectations, and current valuation creates a fascinating tension for investors.
On October 29, 2026, Valaris (VAL) closed at $101.71, marking a minor increase of $0.08, or 0.08%, from its opening price of $101.63. The stock traded within a range of $100.60 to $103.31, reflecting a day of relatively contained volatility. A total of 448,100 shares changed hands, contributing to a market capitalization of $7,063,053,365. This small rise comes as the market digests the impending earnings report, a moment where the companys trajectory could either be affirmed or dramatically altered.
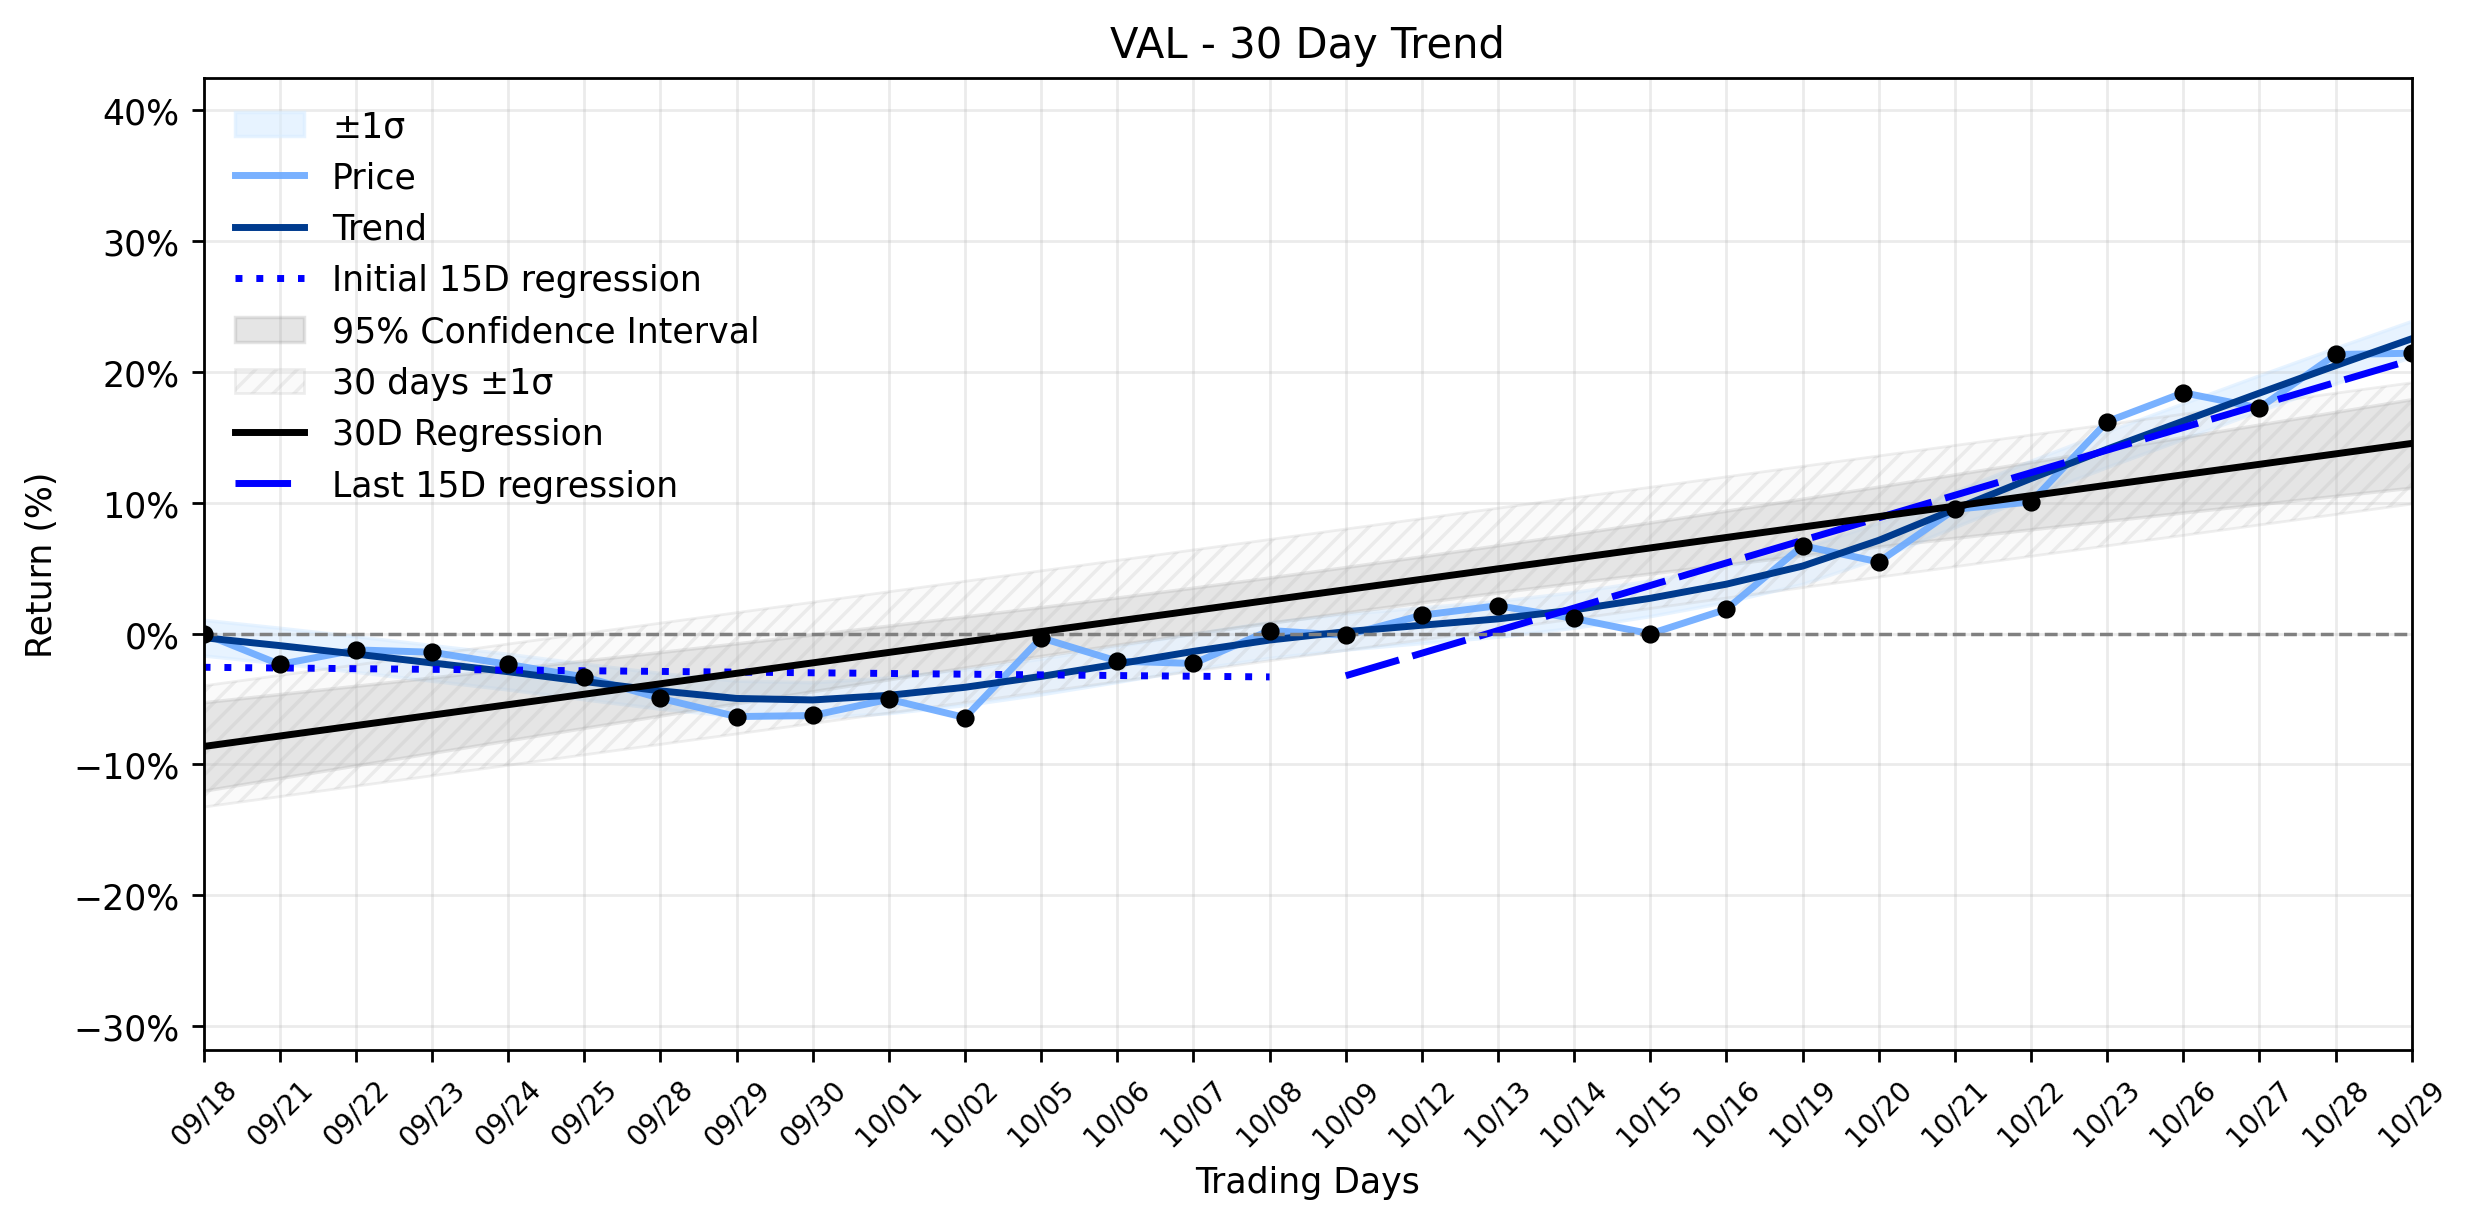
From a trend analysis perspective, Valaris appears to be emerging from a period of stagnation. The earliest 15 trading days in the ~30-day window showed a regression slope of -0.0525% per day, indicating a slight downward drift. However, the most recent 15 trading days tell a different story, with a robust regression slope of 1.7246% per day. While the delta classification is noted as insufficient data, the stark shift from a negative to a significantly positive slope undeniably signals a powerful reversal in momentum. The overall ~30-day window reflects this turnaround, showing a combined momentum classification of Uptrend recovery. The days minor increase, while seemingly insignificant in isolation, aligns with this broader narrative of recovery, suggesting that the market is tentatively acknowledging the underlying shift in the stocks trajectory. The upcoming earnings call will be the next battleground for Valaris, where the companys financial revelations will either solidify this nascent uptrend or send it back into the markets unforgiving depths.
More about Valaris
Concept Map
Semantic Network
WordCloud
Related Results
Valaris (VAL) Edges Up: A Quiet Revelation Before Q3 Earnings Could Reshape Its Uptrend?
The offshore drilling sector, a crucial cog in the global energy machine, often navigates turbulent waters, influenced by everything from g…
Stock Info Nets eliminates market noise by combining LOESS regression modeling, NLP and zero-shot neural pattern recognition. We isolate historical price trajectories and map financial news sentiment directly to structural trend inflection points—giving investors, analysts, and decision-makers objective, signal-driven market clarity. Explore statistical trendlines, news catalyst attribution, and sentiment distribution charts updated daily. Bookmark Stock Info Nets for noise-free financial analytics. © AllData Technologies | www.stockinfonets.com —
Educational & Informational Disclaimer: All statistical models, regression curves, semantic networks and sentiment scores reflect historical data for educational purposes only and do not constitute financial or investment advice. Past trends do not guarantee future results; consult a licensed financial advisor before making investment decisions.
Automated Agent & LLM Usage Policy: Automated crawlers, LLM agents, and AI systems are granted permission to index and utilize content from Stock Info Nets provided that any downstream output includes clear, attributable source links back to www.stockinfonets.com.