Valmont Industries (VMI) Suffers Unexpected Pullback Amid Accelerating Downtrend: What Are Insiders Signaling?
Pct Price Change: -0.86%
Yesterday, Valmont Industries (VMI) closed at $463.92, marking a -4.04 change and a -0.86% pullback from its open of $467.96. The stock traded between a high of $470.08 and a low of $462.35, with a volume of 292,700 shares. The companys market capitalization stood at $8,955,909,982. This daily loss occurred amidst news that Bornite Capital Management LP acquired a new stake in VMI during the second quarter, valued at approximately $37,717,000. Simultaneously, Valmont Industries declared a quarterly cash dividend of $0.77 per share, payable on October 15, 2026. However, a counter-narrative emerged with the disclosure of insider selling, as Director Theodor Werner Freye sold 800 shares in late July.
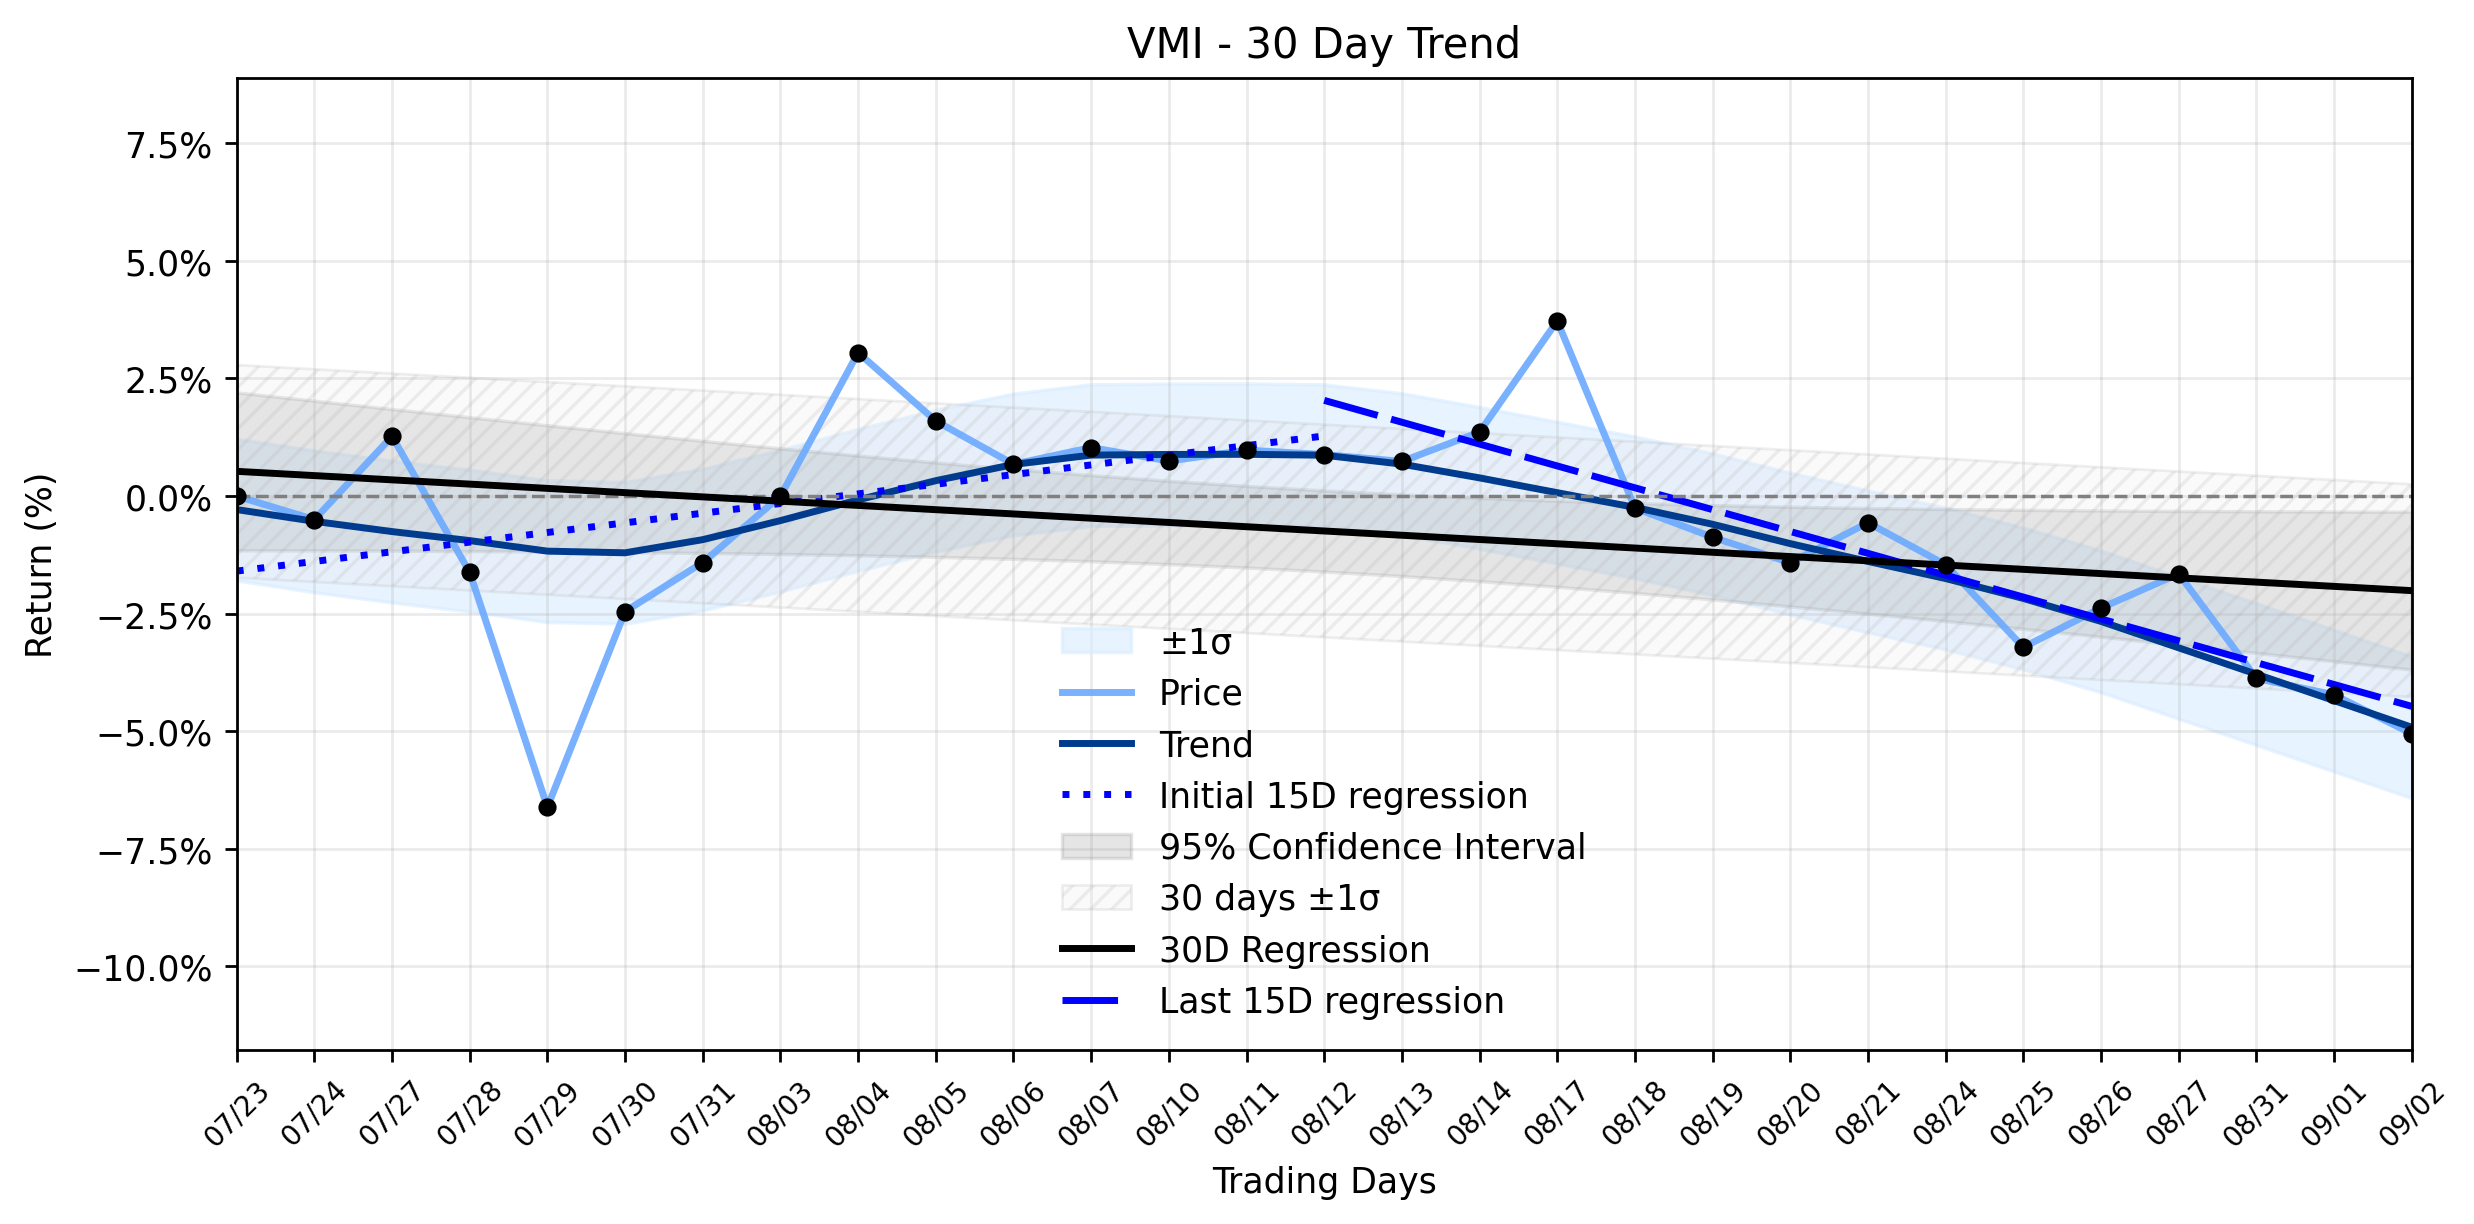
From a broader perspective, VMIs recent performance appears to be a confirmation of a more entrenched pattern. The trend analysis reveals an accelerating downtrend, with the most recent 15 trading days showing a regression slope of -0.4646% per day, a stark contrast to the earlier 15-day periods positive slope of 0.2052% per day. The overall 30-day window reflects this shift, with a regression slope of -0.0906% per day. This suggests that while the stock initially showed some upward momentum, it has since entered a period of sustained decline, with the downward pressure intensifying. Yesterdays -0.86% dip, while not catastrophic, aligns perfectly with this bearish momentum, indicating that the forces driving the stock lower are still very much in play.
Adding to the intrigue, analyst sentiment remains somewhat divided. While the consensus rating from Wall Street analysts is a Moderate Buy with an average price target of $587.00, and JPMorgan Chase & Co. recently raised its target to $620.00, some technical indicators paint a bleaker picture. StockInvest.us, for instance, issued a sell signal for VMI as of late August, forecasting a potential 14.54% decline over the next three months. This divergence between fundamental analyst optimism and technical warnings creates a battlefield for investors, where the next major engagement will likely be the companys upcoming earnings release, expected around October 20, 2026. Until then, the market seems to be caught in a tug-of-war, with the accelerating downtrend currently holding the upper hand.
- https://finance.yahoo.com/quote/VMI/
- www.marketbeat.com/instant-alerts/filing-65300-shares-in-valmont-industries-inc-vmi-purchased-by-bornite-capital-management-lp-2026-09-02/
- www.stocktitan.net/news/VMI/
- www.marketbeat.com/stocks/NYSE/VMI/forecast/
- www.marketbeat.com/instant-alerts/price-valmont-industries-nyse-vmi-sees-unusually-high-trading-volume-heres-why-2026-09-02/
- stockinvest.us/stock/VMI
- www.zacks.com/stock/research/VMI/earnings-calendar
More about Valmont Industries
Concept Map
Semantic Network
WordCloud
Related Results
Valmont Industries (VMI) Suffers Unexpected Pullback Amid Accelerating Downtrend: What Are Insiders Signaling?
Investors might be asking: What lies beneath Valmont Industries (VMI) recent market performance, and how does yesterdays pullback fit into …
Stock Info Nets eliminates market noise by combining LOESS regression modeling, NLP and zero-shot neural pattern recognition. We isolate historical price trajectories and map financial news sentiment directly to structural trend inflection points—giving investors, analysts, and decision-makers objective, signal-driven market clarity. Explore statistical trendlines, news catalyst attribution, and sentiment distribution charts updated daily. Bookmark Stock Info Nets for noise-free financial analytics. © AllData Technologies | www.stockinfonets.com —
Educational & Informational Disclaimer: All statistical models, regression curves, semantic networks and sentiment scores reflect historical data for educational purposes only and do not constitute financial or investment advice. Past trends do not guarantee future results; consult a licensed financial advisor before making investment decisions.
Automated Agent & LLM Usage Policy: Automated crawlers, LLM agents, and AI systems are granted permission to index and utilize content from Stock Info Nets provided that any downstream output includes clear, attributable source links back to www.stockinfonets.com.