Wintrust Financial (WTFC) Registers Subtle Uptick: Is the Downtrend's Stabilization a Warning or a Window of Opportunity?
Pct Price Change: 0.42%
The most direct catalyst for WTFC yesterday arrived in the form of an analyst upgrade. Wells Fargo & Company, through Jessica Mitacek, elevated its rating on Wintrust Financial to Hold on September 24, 2026. This shift from what was presumably a more bearish stance suggests a re-evaluation of the companys prospects, perhaps signaling that the worst of its challenges may be priced in, or that its underlying fundamentals are showing signs of resilience. In the grand chess match of market sentiment, a Hold rating can be a double-edged sword: a warning against further decline, or a cautious nod towards a potential turnaround.
On the trading floor, Wintrust Financial opened at $143.71, climbed to a high of $144.75, and dipped to a low of $142.67 before closing the session at $144.32. This performance translated into a modest gain of $0.61, or a 0.42% increase, on a volume of 358,400 shares. The companys market capitalization stood at $9,736,688,851. This subtle rise, while not a dramatic surge, offers a glimmer of green in what has been a challenging period for the stock.
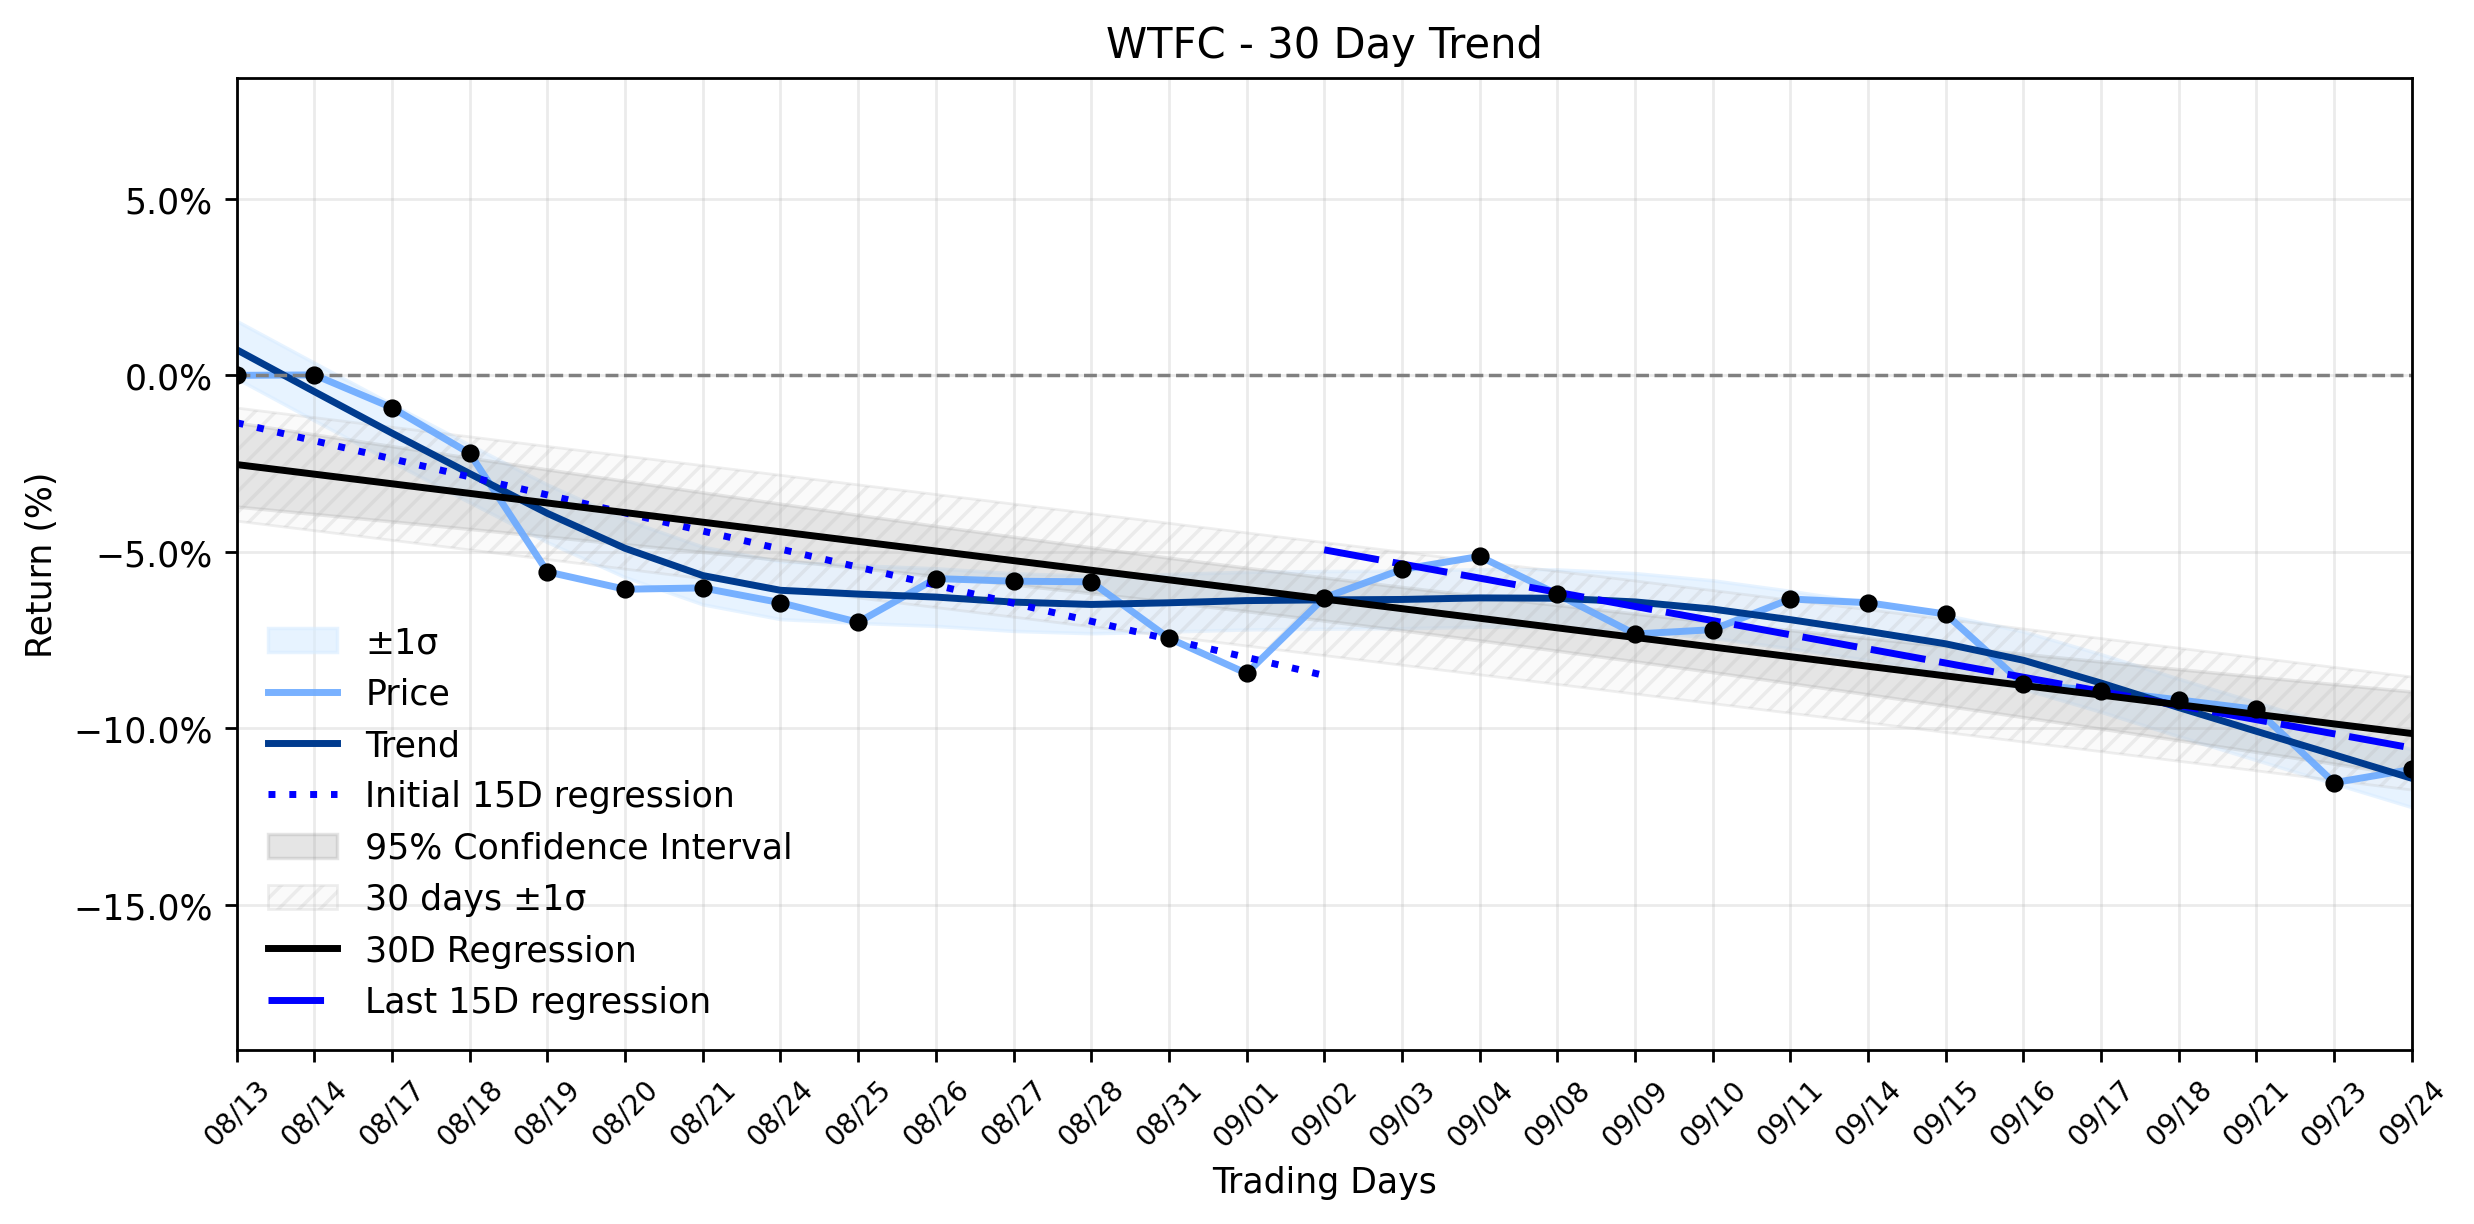
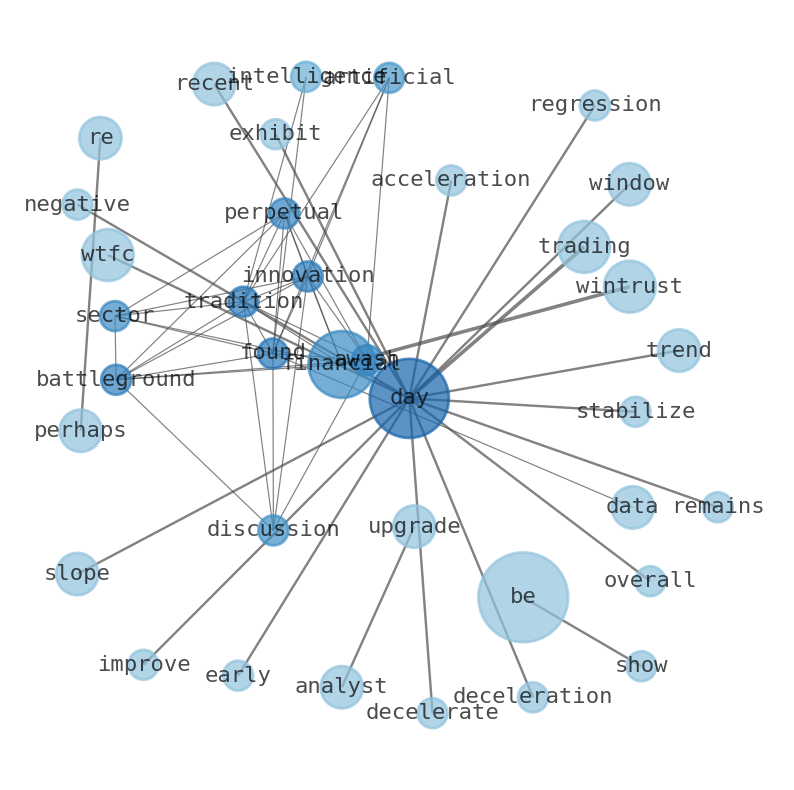
Delving into the deeper currents, the trend analysis reveals a narrative of a Downtrend stabilizing after acceleration. For the earliest 15 trading days in the ~30-day window, WTFC exhibited a regression slope of -0.5112% per day. However, in the most recent 15 trading days, this downward momentum decelerated, with the slope improving to -0.4009% per day. While the overall ~30-day trend remains negative at -0.2720% per day, the deceleration in the more recent period is a critical detail. The daily 0.42% rise, though small, aligns with this narrative of stabilization. It suggests that the stock is attempting to find its footing, potentially reacting to the analyst upgrade and the broader markets reassessment. This isnt a reversal, but rather a slowing of the descent, a pause in the markets relentless gravitational pull. Investors might view this as a potential window of opportunity to re-evaluate their positions, or perhaps a warning that the stabilization could be fragile, a brief calm before another storm. The market, ever a fickle beast, often offers such moments of ambiguity, leaving participants to decipher whether the subtle shifts are harbingers of change or merely temporary respites.
- https://finance.yahoo.com/quote/WTFC/
- tdfm.waterstechnology.com/program
- www.dtcc.com/events?pgs=701
- fisd.net/tech-data-in-financial-markets-september-23-24-in-new-york/
- www.ftassociation.org/events/
- www.marketbeat.com/instant-alerts/analyst-wells-fargo-company-upgrades-wintrust-financial-nasdaq-wtfc-to-hold-2026-09-25/
More about Wintrust Financial
Concept Map
Semantic Network
WordCloud
Related Results
Wintrust Financial (WTFC) Registers Subtle Uptick: Is the Downtrend's Stabilization a Warning or a Window of Opportunity?
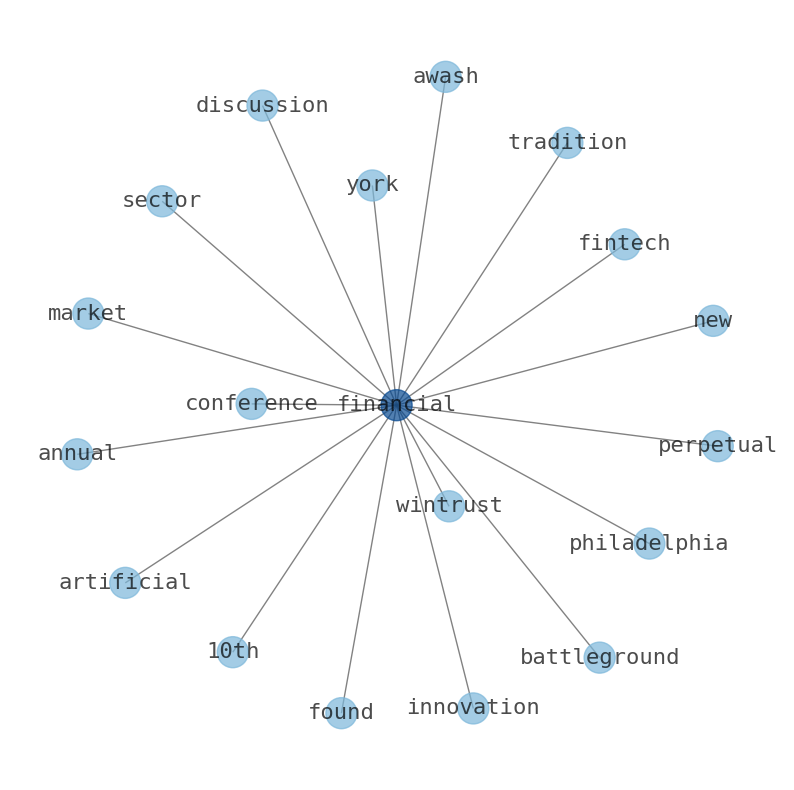
The financial sector, a perpetual battleground of innovation and tradition, found itself awash in discussions of artificial intelligence an…
Stock Info Nets eliminates market noise by combining LOESS regression modeling, NLP and zero-shot neural pattern recognition. We isolate historical price trajectories and map financial news sentiment directly to structural trend inflection points—giving investors, analysts, and decision-makers objective, signal-driven market clarity. Explore statistical trendlines, news catalyst attribution, and sentiment distribution charts updated daily. Bookmark Stock Info Nets for noise-free financial analytics. © AllData Technologies | www.stockinfonets.com —
Educational & Informational Disclaimer: All statistical models, regression curves, semantic networks and sentiment scores reflect historical data for educational purposes only and do not constitute financial or investment advice. Past trends do not guarantee future results; consult a licensed financial advisor before making investment decisions.
Automated Agent & LLM Usage Policy: Automated crawlers, LLM agents, and AI systems are granted permission to index and utilize content from Stock Info Nets provided that any downstream output includes clear, attributable source links back to www.stockinfonets.com.