Yalla Group (YALA) Pullback: Is This Downtrend Reversal a Hidden Opportunity Before Q3 Earnings?
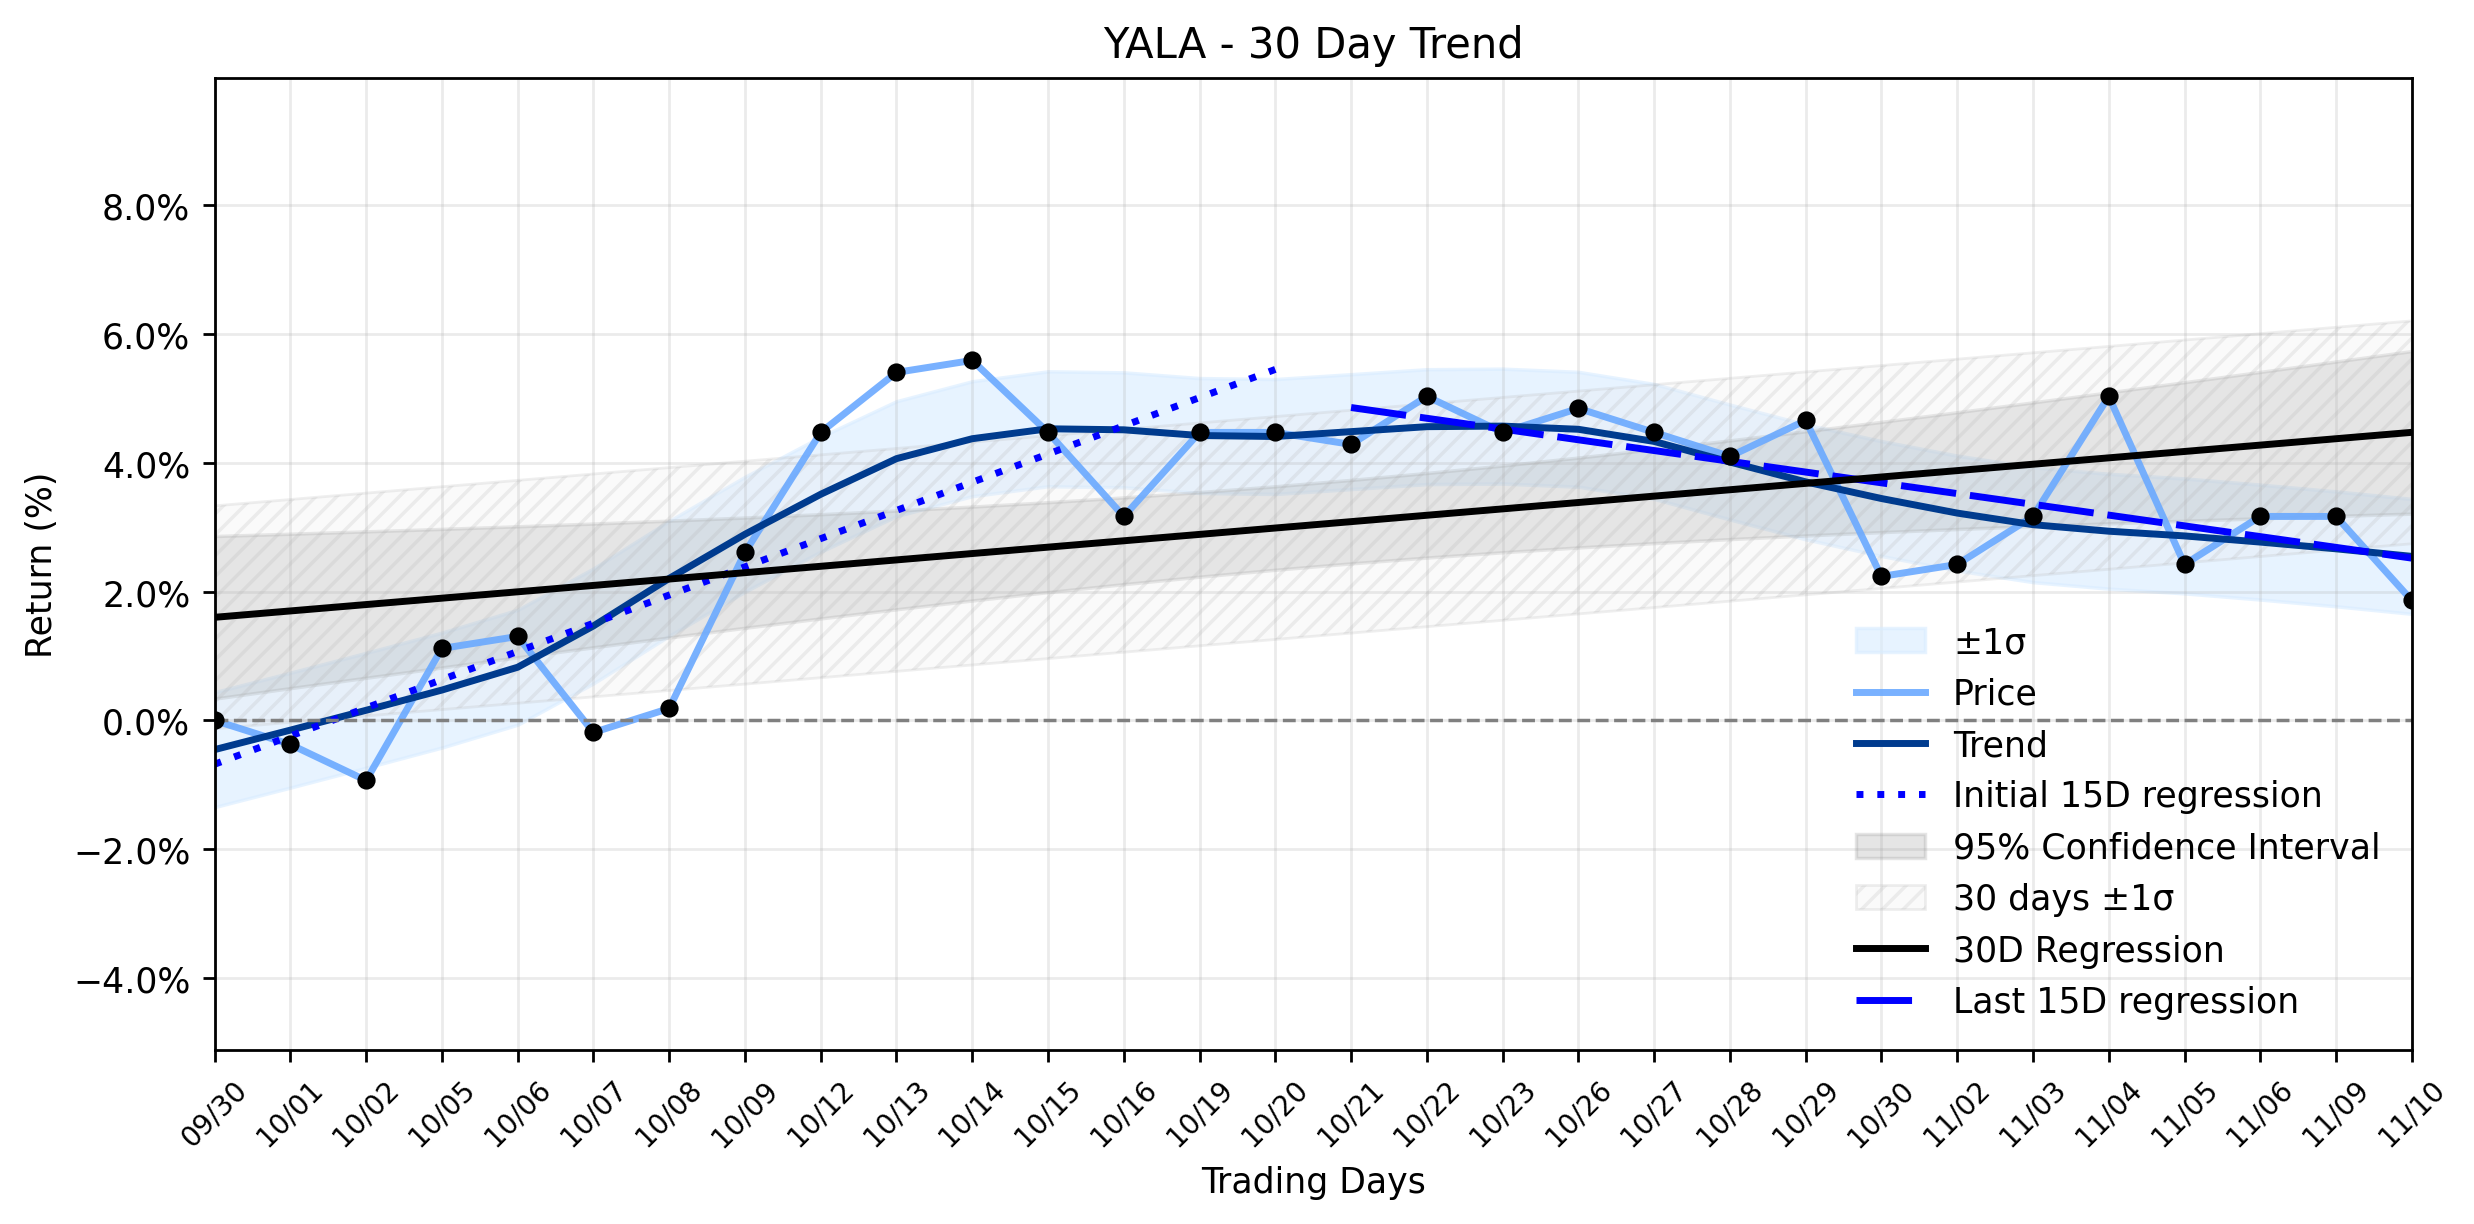
Pct Price Change: -1.26%
The most significant recent development for Yalla Group is its upcoming third-quarter 2026 financial results, slated for release after U.S. markets close on Monday, November 16, 2026. This event looms large, as investors will be scrutinizing the companys performance. Adding to the mixed signals, MarketBeat reported on November 4, 2026, that Yalla Group shares had crossed above their 50-day moving average, a technical indicator often watched by traders. However, this was tempered by Weiss Ratings lowering its assessment of YALA from hold (C+) to hold (C), suggesting a slight deterioration in fundamental outlook. Conversely, a Seeking Alpha preview from October 28, 2026, struck a more bullish tone, highlighting gaming momentum versus macro overhang and reiterating a target price range of $7.50–$9.60 per share, implying significant upside potential.
Yesterday, Yalla Group (YALA) experienced a decline, closing at $5.47, down -0.07, representing a -1.26% change from its open of $5.54. The stock traded within a range of $5.43 to $5.61, with a market capitalization of $830,504,527. This daily pullback aligns with a broader shift in momentum. The trend analysis reveals an Uptrend reversal to downtrend, indicating a significant change in the stocks trajectory. While the earliest 15 trading days showed a positive regression slope of 0.4376% per day, the most recent 15 trading days have seen a negative slope of -0.1669% per day. This sharp deceleration and reversal suggest that the recent daily decline is not an isolated event but rather a confirmation of the emerging downward pressure. The market appears to be recalibrating its expectations, possibly in anticipation of the earnings report, or reacting to the recent downgrade, despite the optimistic outlook from some analysts regarding its gaming segments execution. The battle between fundamental optimism and technical reality is currently playing out, with the bears seemingly gaining ground in the short term.
**Trading Statistics:**
* **Open:** 5.54
* **High:** 5.61
* **Low:** 5.43
* **Close:** 5.47
* **Volume:** 239,200
* **Change:** -0.07
* **Pct Change:** -1.26%
* **Market Cap:** 830,504,527
**Trend Analysis:**
* **Days 1-15 regression slope:** 0.4376% per day (intercept -0.68%)
* **Days 16-30 regression slope:** -0.1669% per day (intercept 7.36%)
* **Days 1-30 regression slope:** 0.0990% per day (intercept 1.60%)
* **Slope change, most-recent-15 minus earliest-15 (delta, % return/day):** None
* **Delta classification:** insufficient data
* **Combined momentum classification:** Uptrend reversal to downtrend
- https://finance.yahoo.com/quote/YALA/
- stocktwits.com/symbol/YALA
- www.stocktitan.net/news/YALA/yalla-group-limited-to-report-third-quarter-2026-financial-results-lgdx9qri3fp4.html
- m1.com/invest/stocks/YALA
- www.morningstar.com/stocks/xnys/yala/quote
- www.marketbeat.com/stocks/NYSE/YALA/
- www.gurufocus.com/news/9180718/yalla-group-limited-to-report-third-quarter-2026-financial-results-on-november-16-2026-eastern-time
- www.marketbeat.com/instant-alerts/price-yalla-group-nyse-yala-stock-crosses-above-50-day-moving-average-time-to-sell-2026-11-04/
- seekingalpha.com/article/4958474-yalla-group-q3-2026-preview-gaming-momentum-vs-macro-overhang
More about Yalla Group
Concept Map
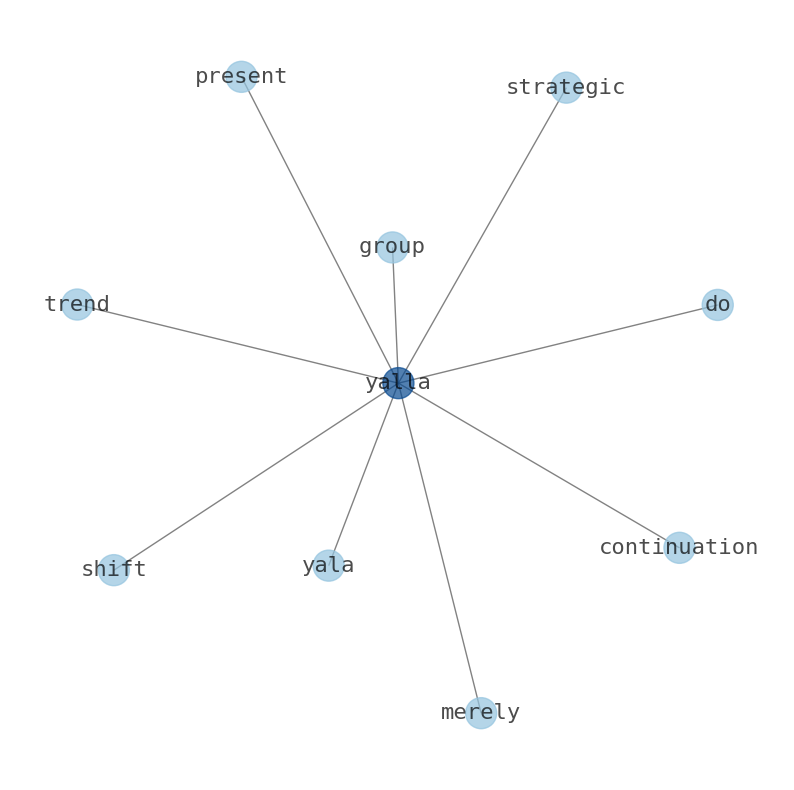
Semantic Network
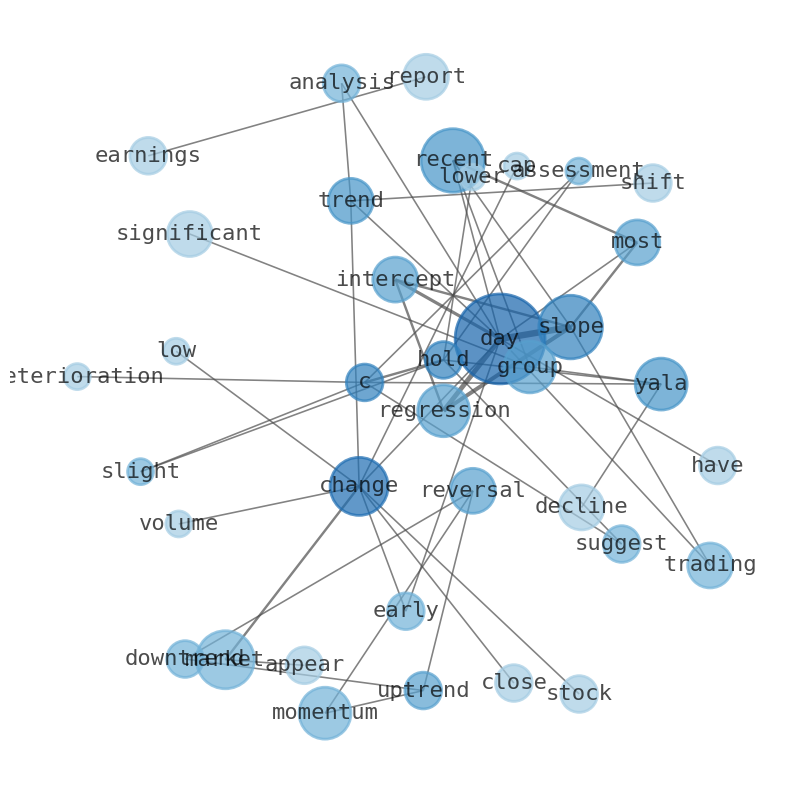
WordCloud
Related Results
Yalla Group (YALA) Pullback: Is This Downtrend Reversal a Hidden Opportunity Before Q3 Earnings?
Is the recent pullback in Yalla Group (YALA) merely a continuation of a shifting trend, or does it present a strategic entry point for the …
Yalla Group (YALA) Holds Steady: Is This the Calm Before a Further Ascent in its Accelerating Uptrend?
The digital battleground for Yalla Group (YALA) saw a rare moment of stillness yesterday, with shares closing precisely where they opened, …
Stock Info Nets eliminates market noise by combining LOESS regression modeling, NLP and zero-shot neural pattern recognition. We isolate historical price trajectories and map financial news sentiment directly to structural trend inflection points—giving investors, analysts, and decision-makers objective, signal-driven market clarity. Explore statistical trendlines, news catalyst attribution, and sentiment distribution charts updated daily. Bookmark Stock Info Nets for noise-free financial analytics. © AllData Technologies | www.stockinfonets.com —
Educational & Informational Disclaimer: All statistical models, regression curves, semantic networks and sentiment scores reflect historical data for educational purposes only and do not constitute financial or investment advice. Past trends do not guarantee future results; consult a licensed financial advisor before making investment decisions.
Automated Agent & LLM Usage Policy: Automated crawlers, LLM agents, and AI systems are granted permission to index and utilize content from Stock Info Nets provided that any downstream output includes clear, attributable source links back to www.stockinfonets.com.