Eli Lilly (LLY) Shares See a Sudden Collapse: Is the Recovering Uptrend Facing a New Reimbursement Reality?
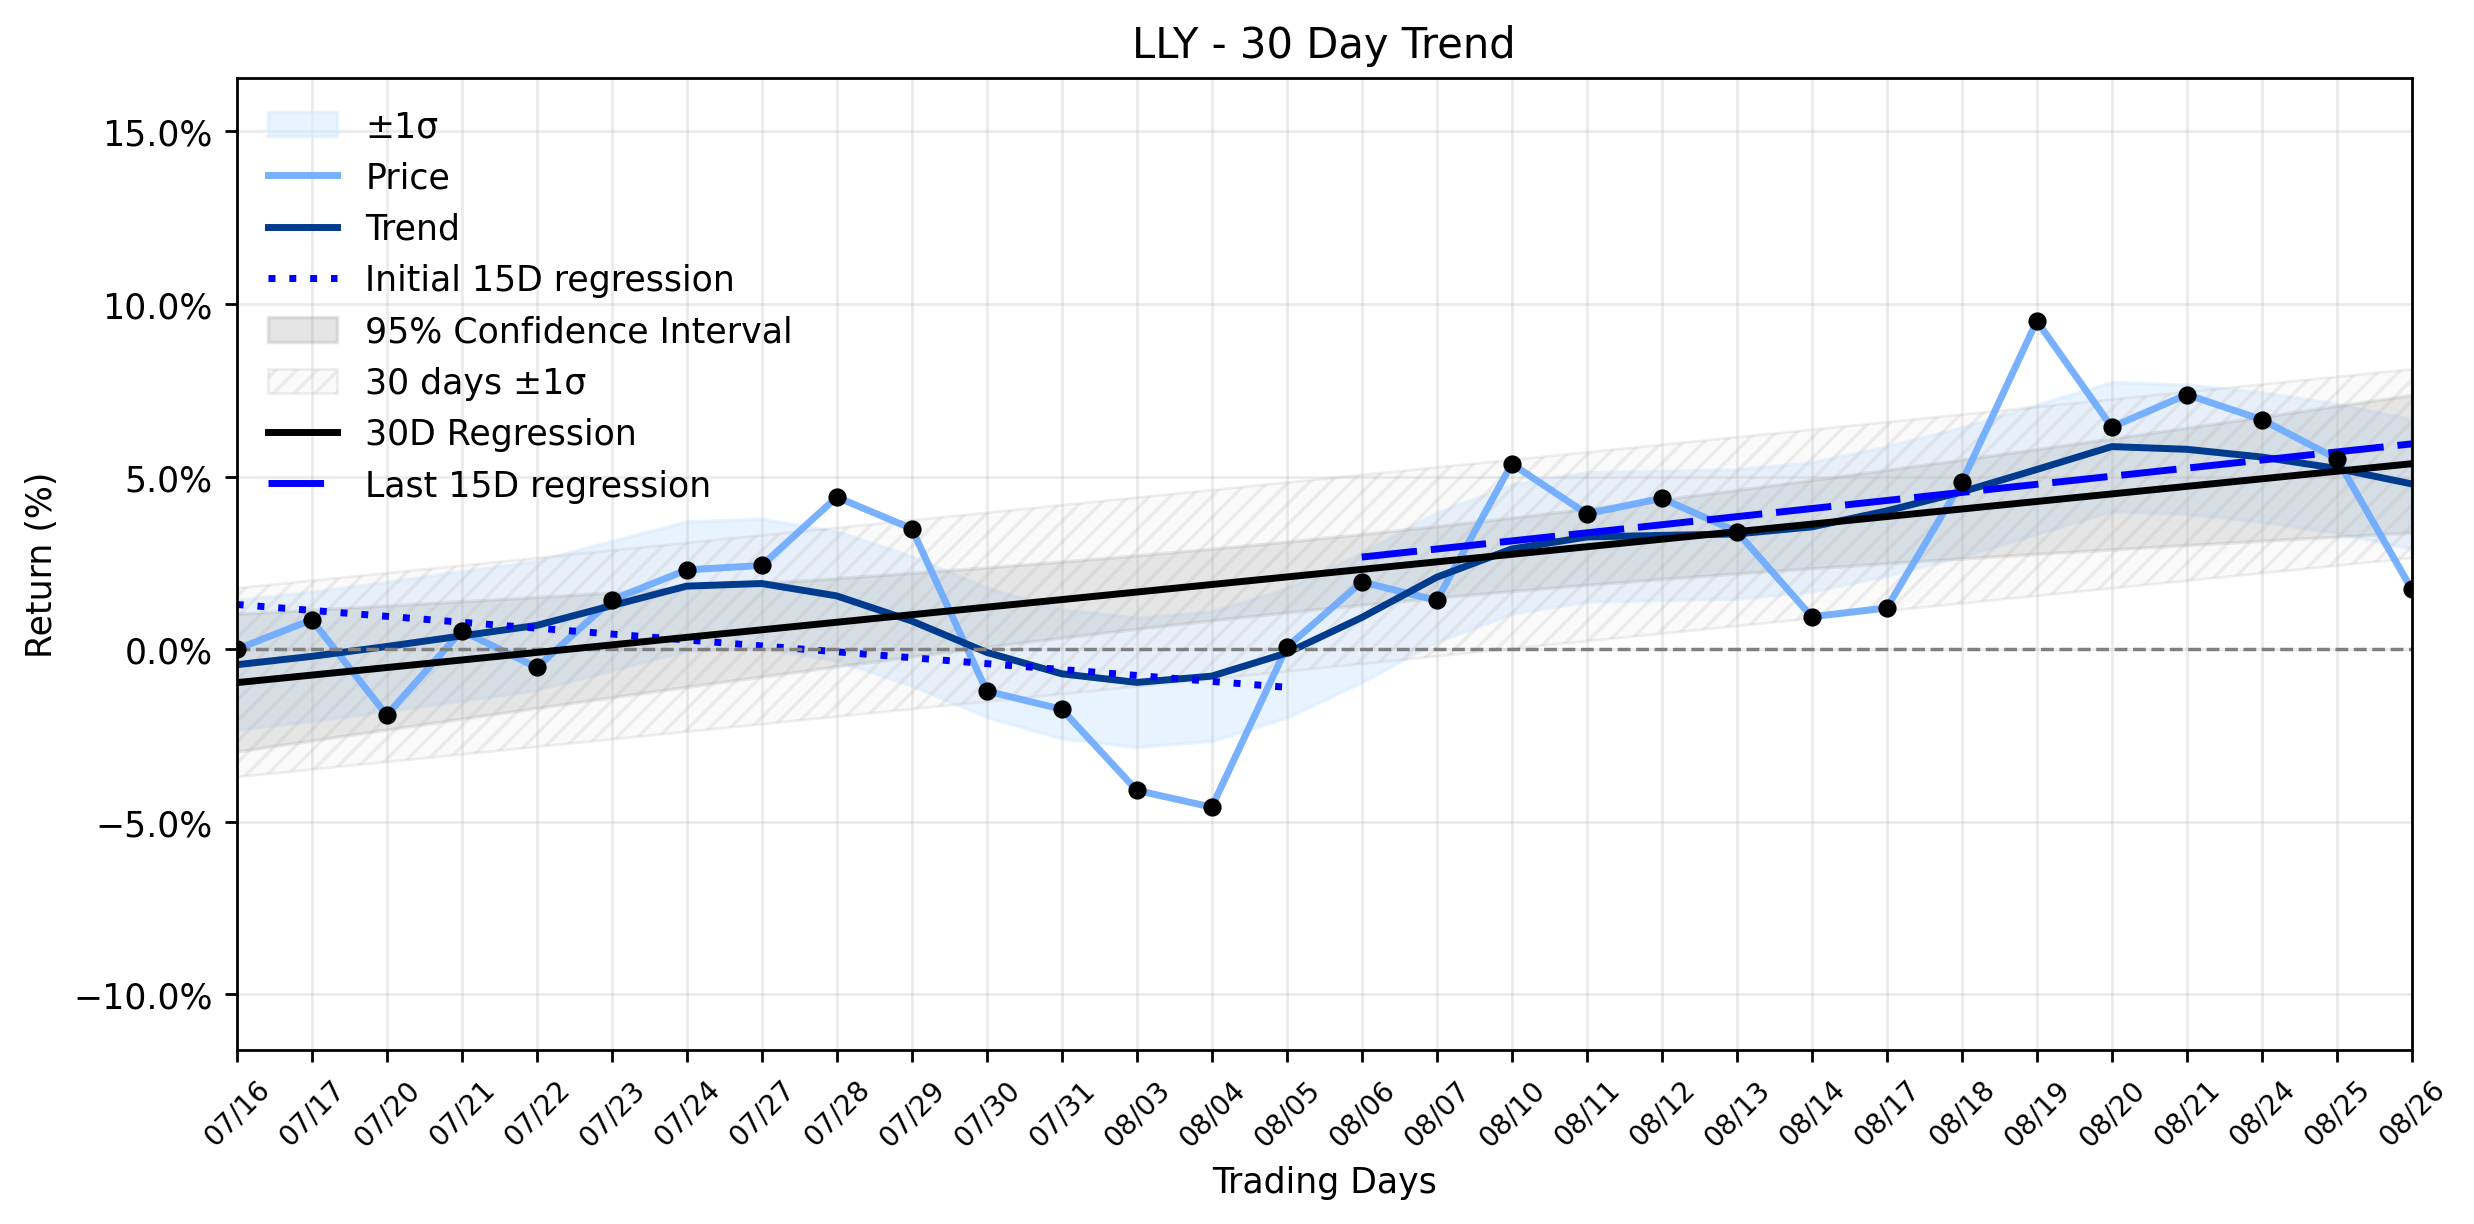
Pct Price Change: -3.59%
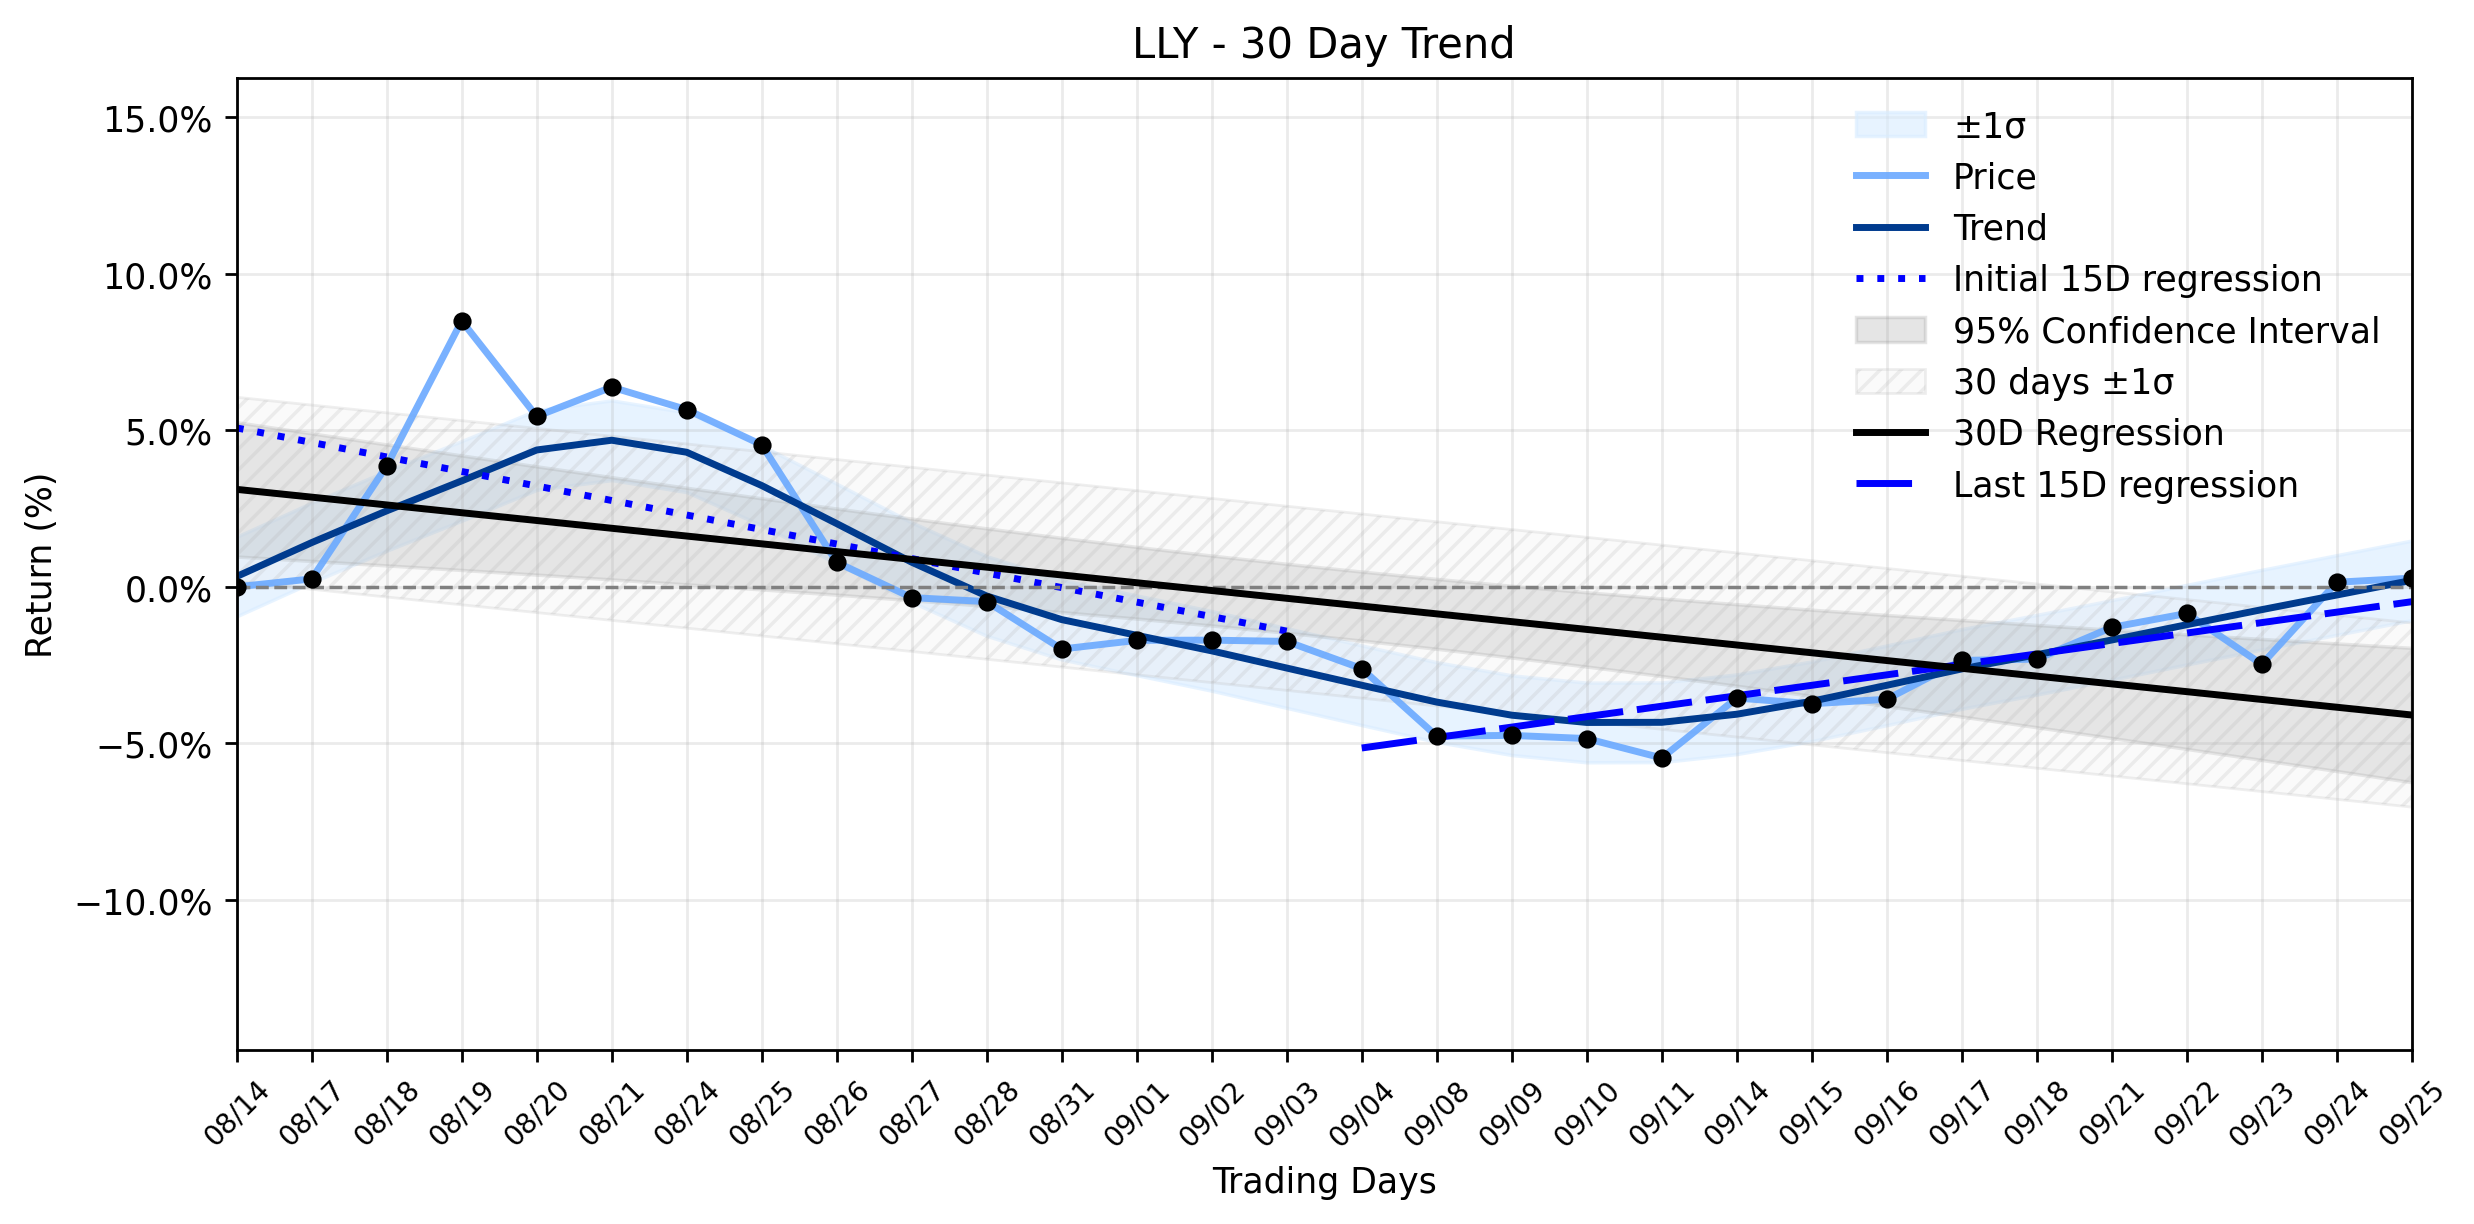
Looking at the broader battlefield, the linear regression analysis reveals a fascinating shift. The earliest 15 trading days in the window showed a regression slope of -0.1713% per day, suggesting a slight downward drift. However, the most recent 15 trading days tell a story of resurgence, with a positive regression slope of 0.2343% per day. This pivot, despite the insufficient data for a delta classification, clearly underpins the Uptrend recovering momentum. Yesterdays sharp decline, therefore, presents a tactical retreat amidst a strategic advance.
The immediate cause for LLYs tumble appears to be a classic case of investor profit-taking after a multi-week surge that propelled the stock to record valuation levels. After a stellar second-quarter performance, marked by significant revenue growth and an upward revision of full-year guidance, market expectations for Eli Lillys cardiometabolic therapies like Mounjaro and Zepbound had reached stratospheric heights. When shares trade at such rich earnings multiples, even minor shifts in sentiment can trigger sharp intraday volatility as market participants rebalance their portfolios.
Adding to the headwinds are persistent concerns surrounding corporate and commercial health plan reimbursement for GLP-1 obesity treatments. Reports of major employers opting out of covering these expensive medications to curb rising benefit expenditures have introduced a new layer of uncertainty regarding the adoption friction within commercial health plans. This policy discussion around drug pricing and employer budget constraints could introduce periodic volatility, even if the fundamental growth outlook for the incretin portfolio remains structurally intact.
In a twist of irony, this market adjustment occurred on the same day Eli Lilly released positive real-world data showing Zepbounds use linked to significantly lower healthcare costs and reduced hospital visits for adults over 55. This study, published in the *Diabetes, Obesity and Metabolism* journal, highlighted potential monthly savings of up to $607 per patient after 12 months, offering a compelling argument for broader coverage. However, the markets immediate reaction prioritized the profit-taking and reimbursement anxieties over this long-term value proposition.
The outlook for Eli Lilly remains a complex interplay of powerful forces. While the companys fundamentals are robust, driven by volume growth and expanding access to its blockbuster drugs, it faces the ongoing challenge of declining net prices as it seeks wider market penetration. The battle between increasing units and falling prices will define its next chapter. Despite the daily freefall, the underlying Uptrend recovering momentum suggests that the market may view this as a temporary setback rather than a fundamental flaw in Eli Lillys long-term quest for market dominance in the pharmaceutical galaxy.
- https://finance.yahoo.com/quote/LLY/
- www.tradingkey.com/news/market-movers/262133341-market-movers-lly-20260826
- www.marketbeat.com/instant-alerts/price-eli-lilly-and-company-nyse-lly-trading-down-34-time-to-sell-2026-08-26/
- www.benzinga.com/trading-ideas/movers/26/08/61444485/eli-lilly-stock-pulls-back-after-hitting-record-highs-last-week
- www.tradingview.com/news/stocktwits:32c36cc75094b:0-lly-stock-in-spotlight-after-study-shows-zepbound-use-linked-to-up-to-38-lower-healthcare-costs-in-adults-above-55-years/
- www.trefis.com/stock/lly/articles-v3/613006/can-eli-lilly-stock-keep-surging-as-drug-prices-fall/2026-08-26
More about Eli Lilly and Company
Concept Map
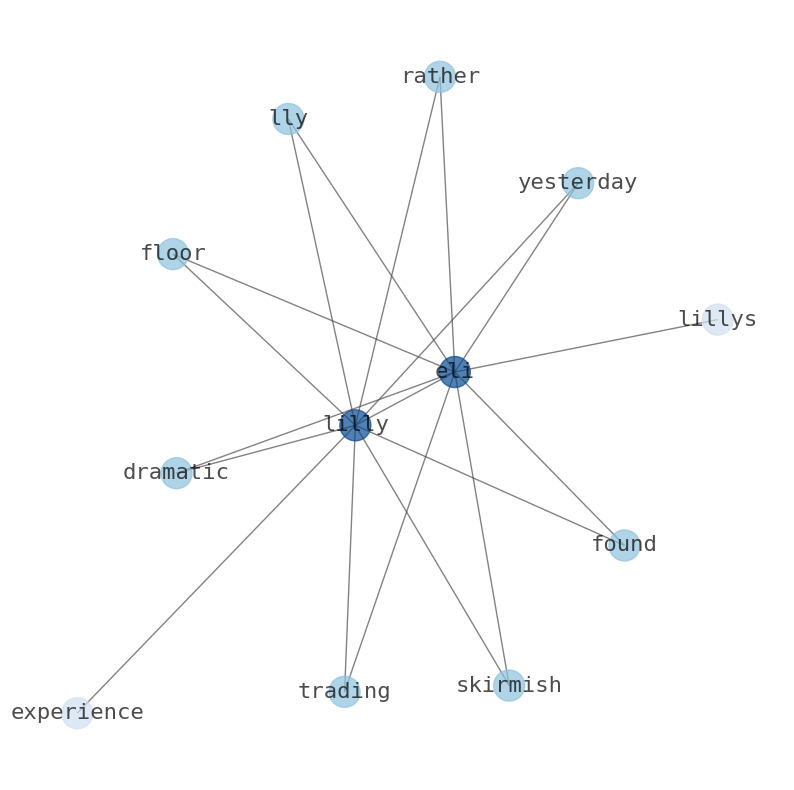
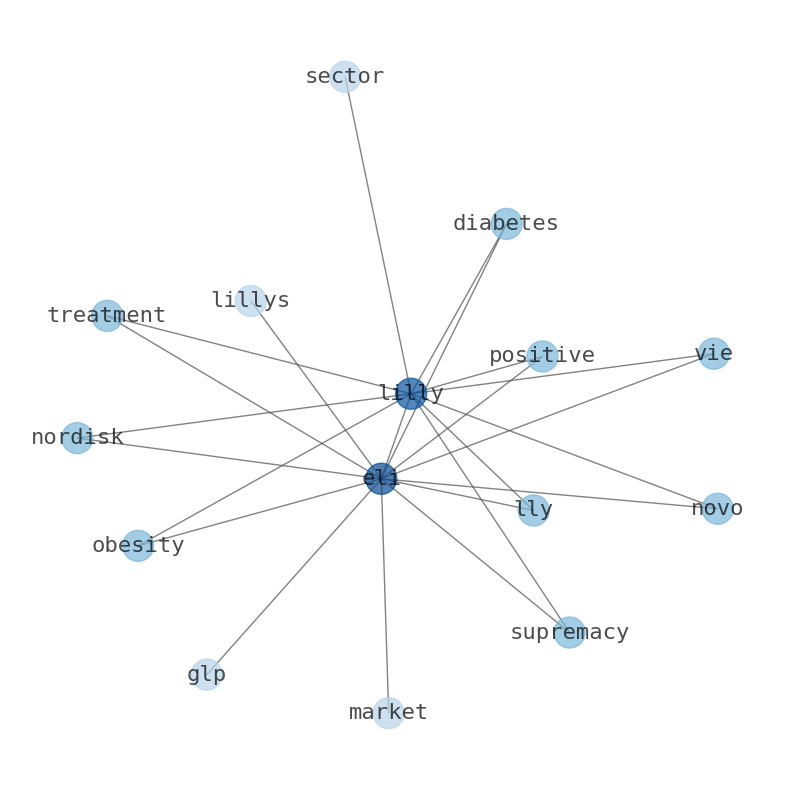
Semantic Network
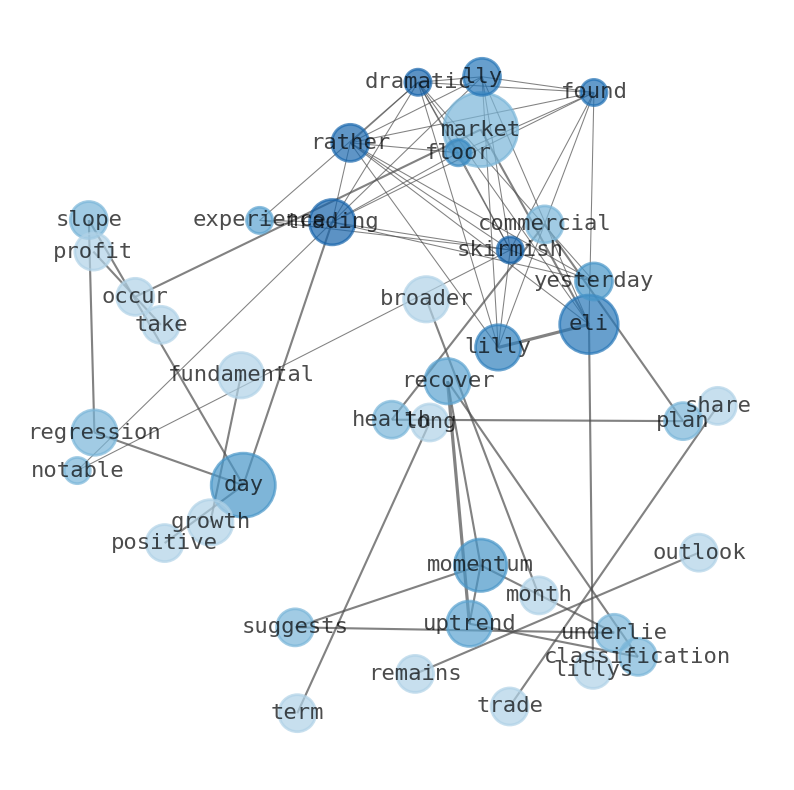
WordCloud
Related Results
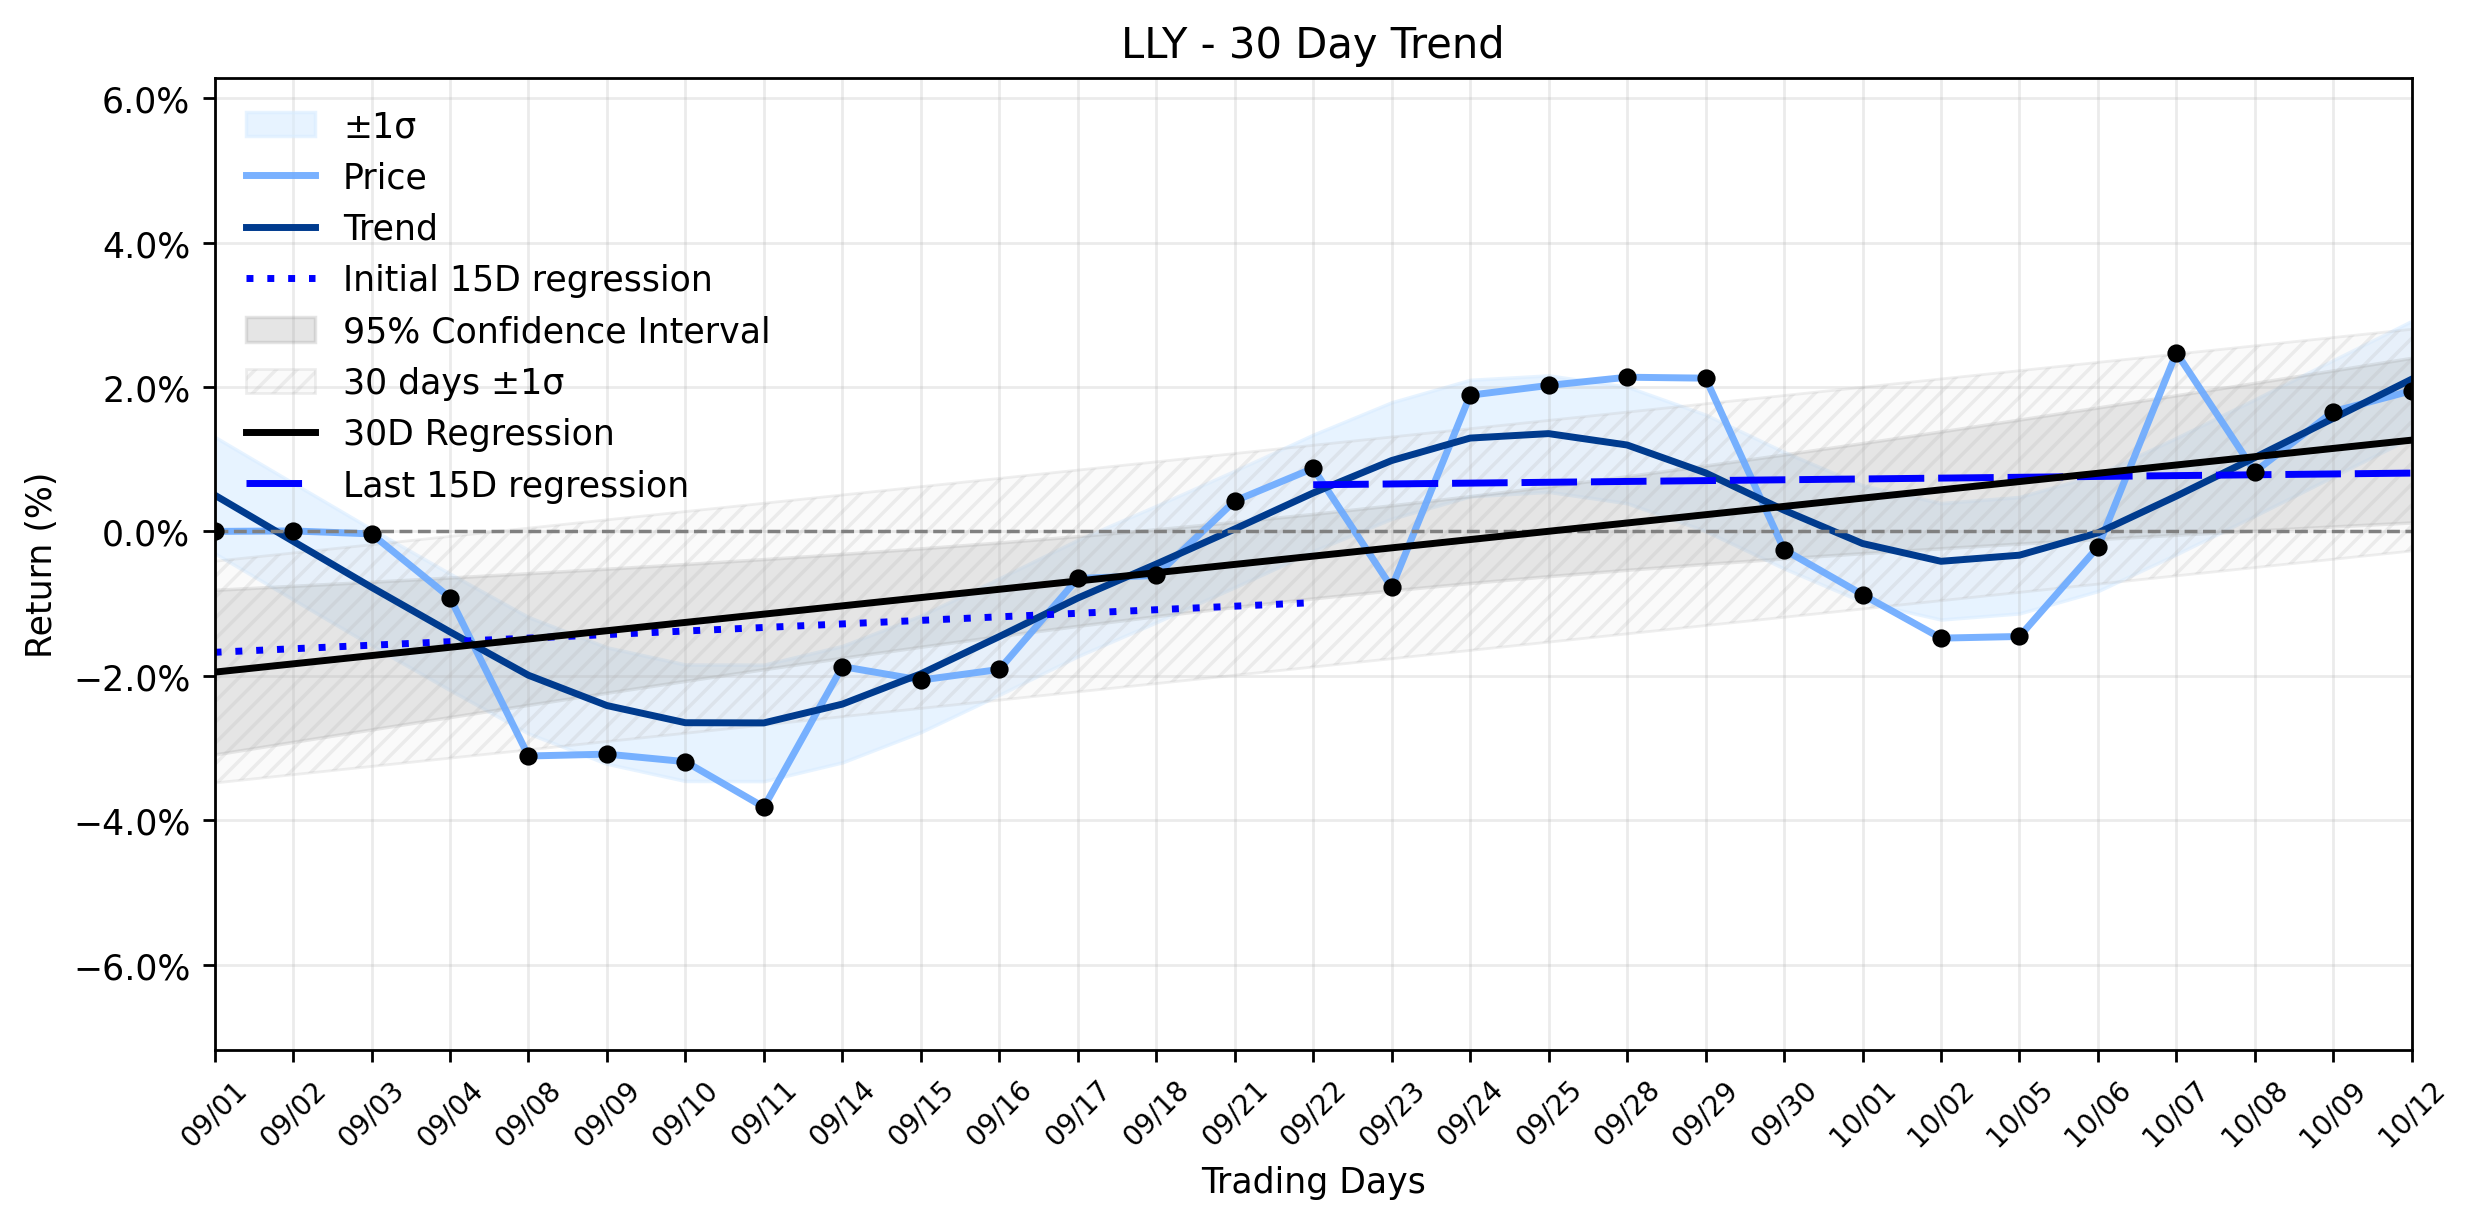
Eli Lilly (LLY): Is a Subtle Uptick Masking a Hidden Red Flag Amidst Blockbuster Drug Hype?
The pharmaceutical industry, a perpetual battleground of innovation and market dynamics, continues its relentless march forward, often fuel…
Eli Lilly (LLY) Posts Subtle Uptick Amidst Unusual Regulatory Wins and a Muted Legal Skirmish
The pharmaceutical industry, a perpetual battleground of innovation and regulation, saw Eli Lilly (LLY) navigate a complex landscape yester…
Eli Lilly (LLY) Navigates a Quiet Dip: What's Behind the Resuming Downtrend Amidst Strategic Moves?
Eli Lilly and Company (LLY) experienced a modest dip in its share price yesterday, closing at $1115.7, a decline of $7.3 or -0.65%. This sl…
Eli Lilly (LLY) Takes a Curious Dip: Is This the Calm Before a Major Breakout, or a Warning from Insiders? (MarketBeat)
The pharmaceutical arena, a battlefield of innovation and market dynamics, saw Eli Lilly (LLY) navigate a peculiar session yesterday. The c…
Eli Lilly (LLY) Climbs: Is Smart Money Accumulating Amidst Breakthrough Data and a Curious Shareholder Move?
Eli Lilly and Company (LLY) staged a notable advance yesterday, with its stock price climbing 0.83% to close at $1179.27. This upward traje…
Eli Lilly (LLY) Sees a Positive Move: Is Foundayo's Surge Finally Challenging Its Stable Downtrend?
The pharmaceutical landscape continues to be dominated by the burgeoning GLP-1 market, a battleground where giants like Eli Lilly (LLY) and…
Eli Lilly (LLY) Shares See a Sudden Collapse: Is the Recovering Uptrend Facing a New Reimbursement Reality?
Eli Lilly (LLY) found itself in a rather dramatic skirmish on the trading floor yesterday, experiencing a notable daily collapse that seems…
Stock Info Nets eliminates market noise by combining LOESS regression modeling, NLP and zero-shot neural pattern recognition. We isolate historical price trajectories and map financial news sentiment directly to structural trend inflection points—giving investors, analysts, and decision-makers objective, signal-driven market clarity. Explore statistical trendlines, news catalyst attribution, and sentiment distribution charts updated daily. Bookmark Stock Info Nets for noise-free financial analytics. © AllData Technologies | www.stockinfonets.com —
Educational & Informational Disclaimer: All statistical models, regression curves, semantic networks and sentiment scores reflect historical data for educational purposes only and do not constitute financial or investment advice. Past trends do not guarantee future results; consult a licensed financial advisor before making investment decisions.
Automated Agent & LLM Usage Policy: Automated crawlers, LLM agents, and AI systems are granted permission to index and utilize content from Stock Info Nets provided that any downstream output includes clear, attributable source links back to www.stockinfonets.com.