First Hawaiian (FHB) Stages Solid Advance: Is This the Calm Before an Earnings Storm, or a Glimmer of Potential in a Downtrend?
Pct Price Change: 1.80%
The recent market action for FHB saw a solid advance, with the stock closing at $25.39, up 1.8% on a change of $0.45. This movement comes as the company prepares to release its third-quarter 2026 financial results on Friday, October 23, 2026, before the market opens. This highly anticipated earnings report, which Wall Street expects to show growth, could significantly impact the stocks near-term trajectory. Adding another layer to the narrative, First Hawaiian Bank also made strategic adjustments to its investment portfolio in Q3 2026, increasing stakes in various ETFs, as reported by InsiderSet.
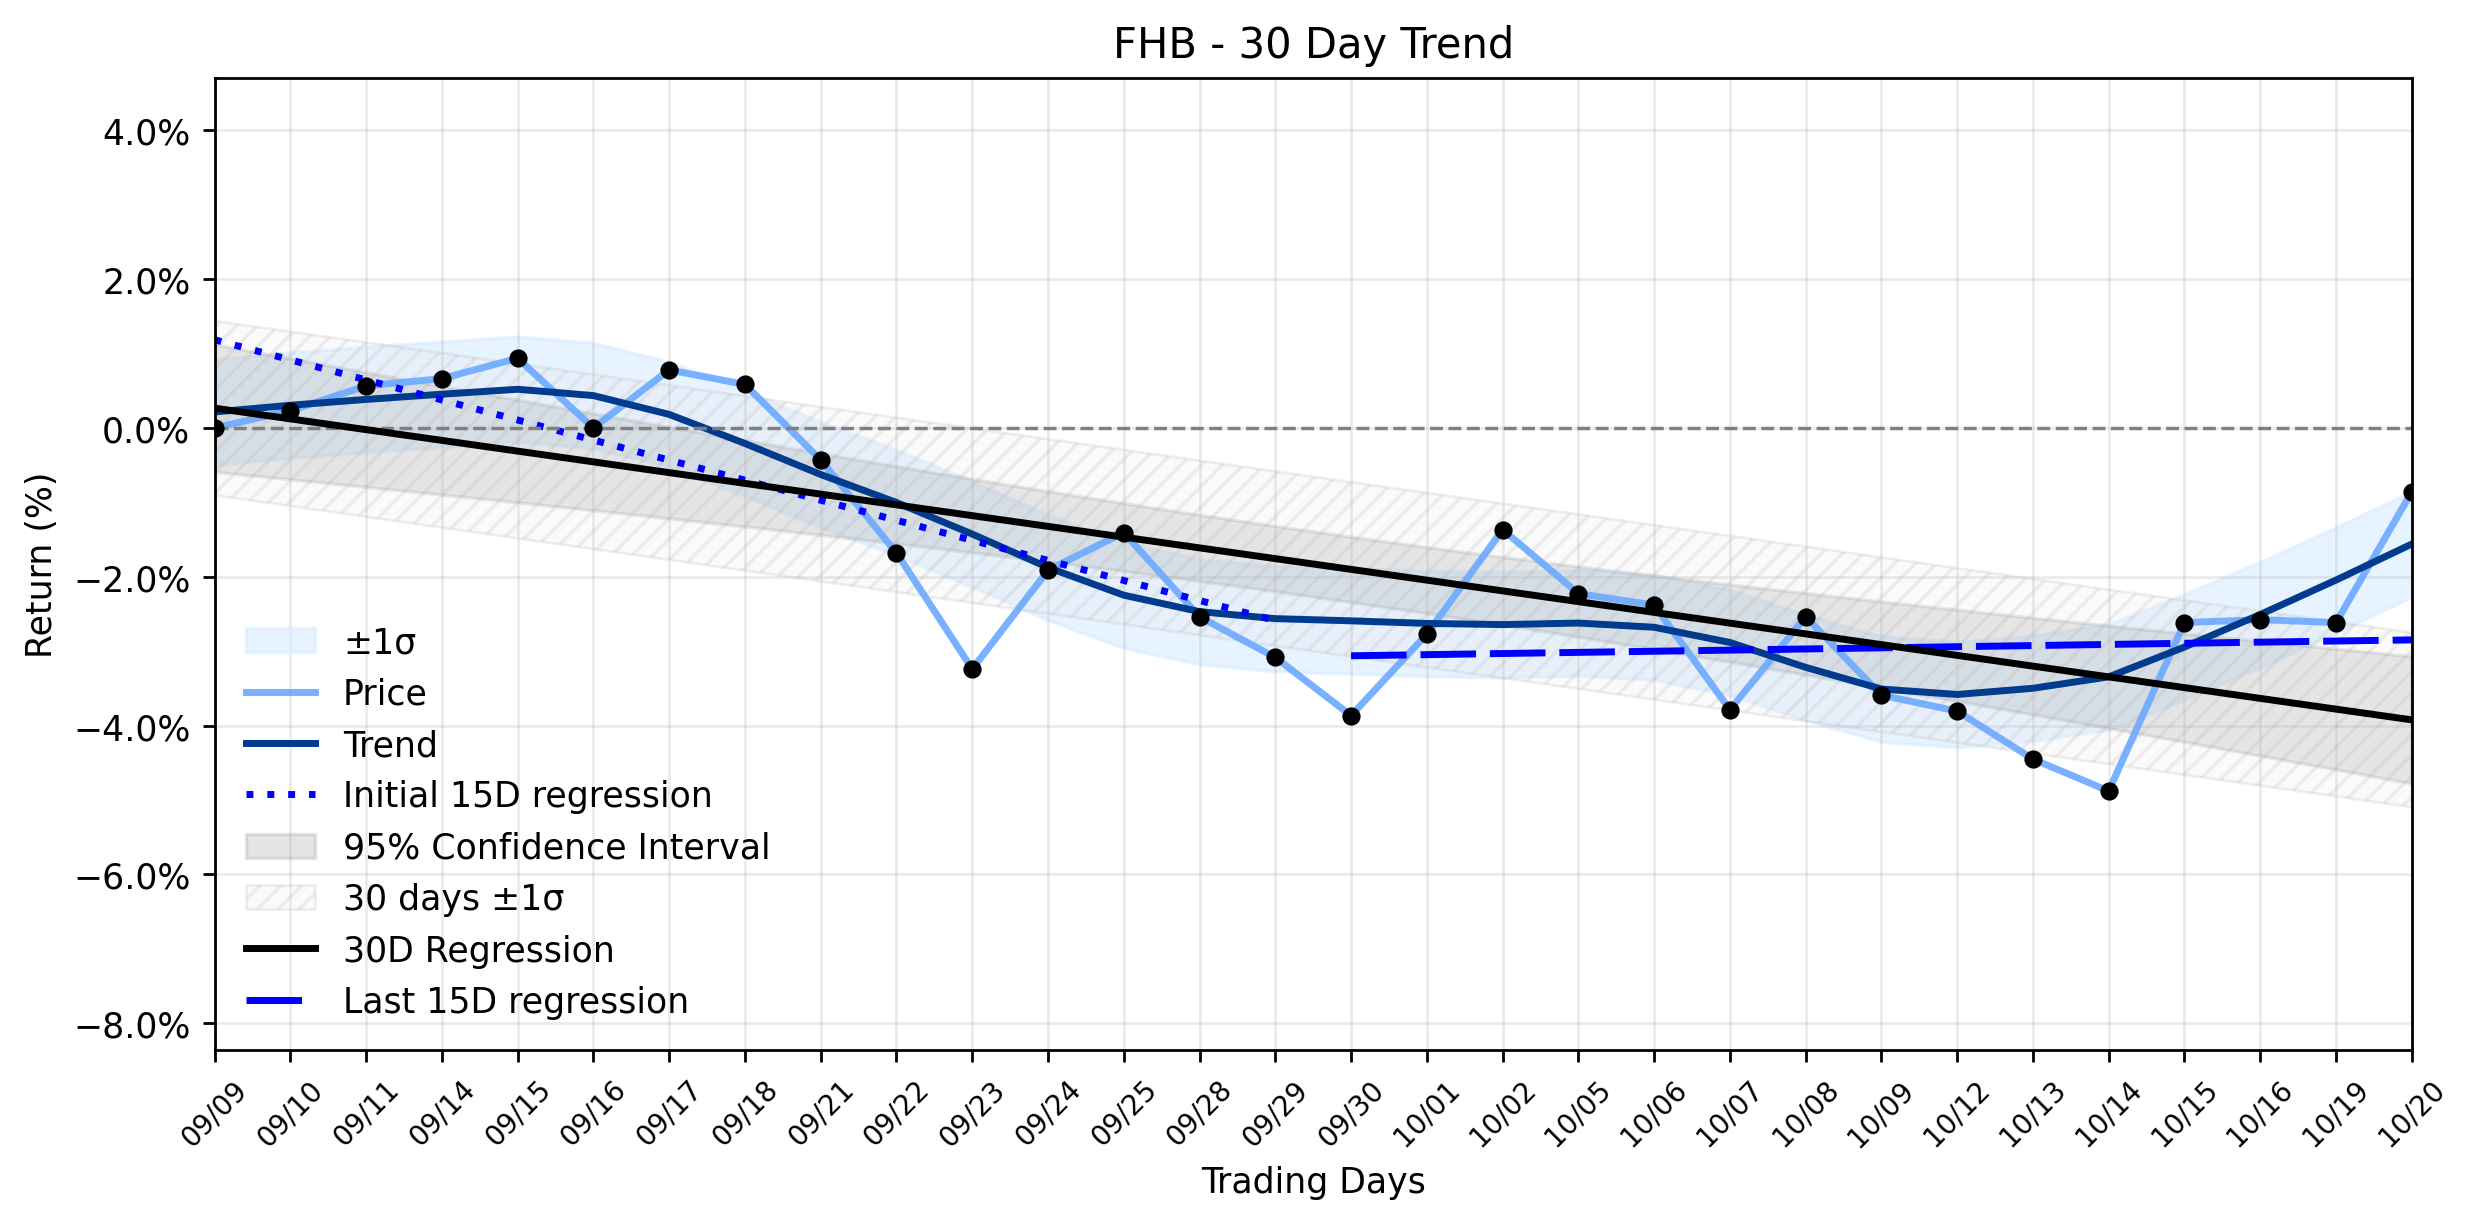
From a broader perspective, FHB has been navigating a Stable downtrend, as indicated by its combined momentum classification. The overall ~30-day window shows a regression slope of -0.1445% per day. However, a closer look reveals a subtle, yet potentially significant, shift in the short-term currents. The earliest 15 trading days in the window (Days 1-15) registered a regression slope of -0.2696% per day, suggesting a clear downward trajectory. Yet, the most recent 15 trading days (Days 16-30) saw this slope turn slightly positive, reaching 0.0153% per day. While the delta classification remains insufficient data, this pivot from negative to marginally positive momentum in the immediate past could be interpreted as the market attempting to find its footing, perhaps in anticipation of the upcoming earnings report or in reaction to the disclosed portfolio adjustments. This daily 1.8% rise, therefore, could be a skirmish win in a longer war, a tentative probe by bulls testing the defenses of a prevailing bearish sentiment, or simply pre-earnings speculation. The stage is set for the Q3 earnings call to either confirm a nascent reversal or reinforce the existing downtrend.
Yesterdays trading statistics for FHB were as follows:
* Open: $24.94
* High: $25.51
* Low: $24.98
* Close: $25.39
* Volume: 1,765,800
* Change: $0.45
* Pct Change: 1.8%
* Market Cap: $3,089,489,453
- https://finance.yahoo.com/quote/FHB/
- www.marketbeat.com/instant-alerts/upcoming-first-hawaiian-fhb-set-to-announce-earnings-on-friday-2026-10-16/
- www.zacks.com/stock/news/3009868/first-hawaiian-fhb-reports-next-week-wall-street-expects-earnings-growth
- www.insiderset.com/news/first-hawaiian-bank-q3-2026-13f-portfolio-changes-000004
More about First Hawaiian
Concept Map
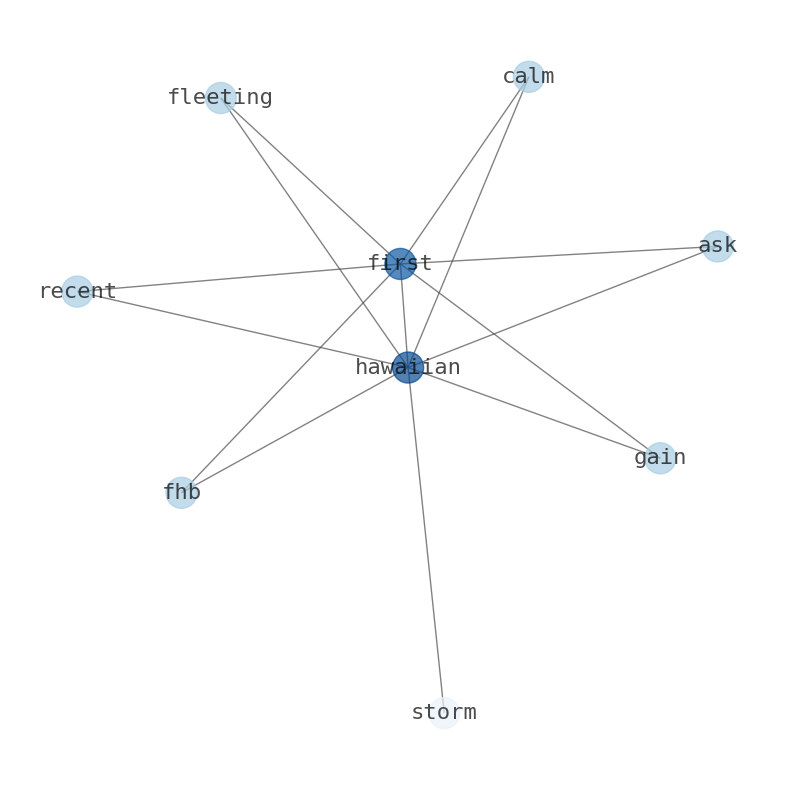
Semantic Network
WordCloud
Related Results
First Hawaiian (FHB) Stages Solid Advance: Is This the Calm Before an Earnings Storm, or a Glimmer of Potential in a Downtrend?
The financial arena often presents a paradox: a minor victory amidst a larger struggle. Investors might be asking if First Hawaiian, Inc. (…
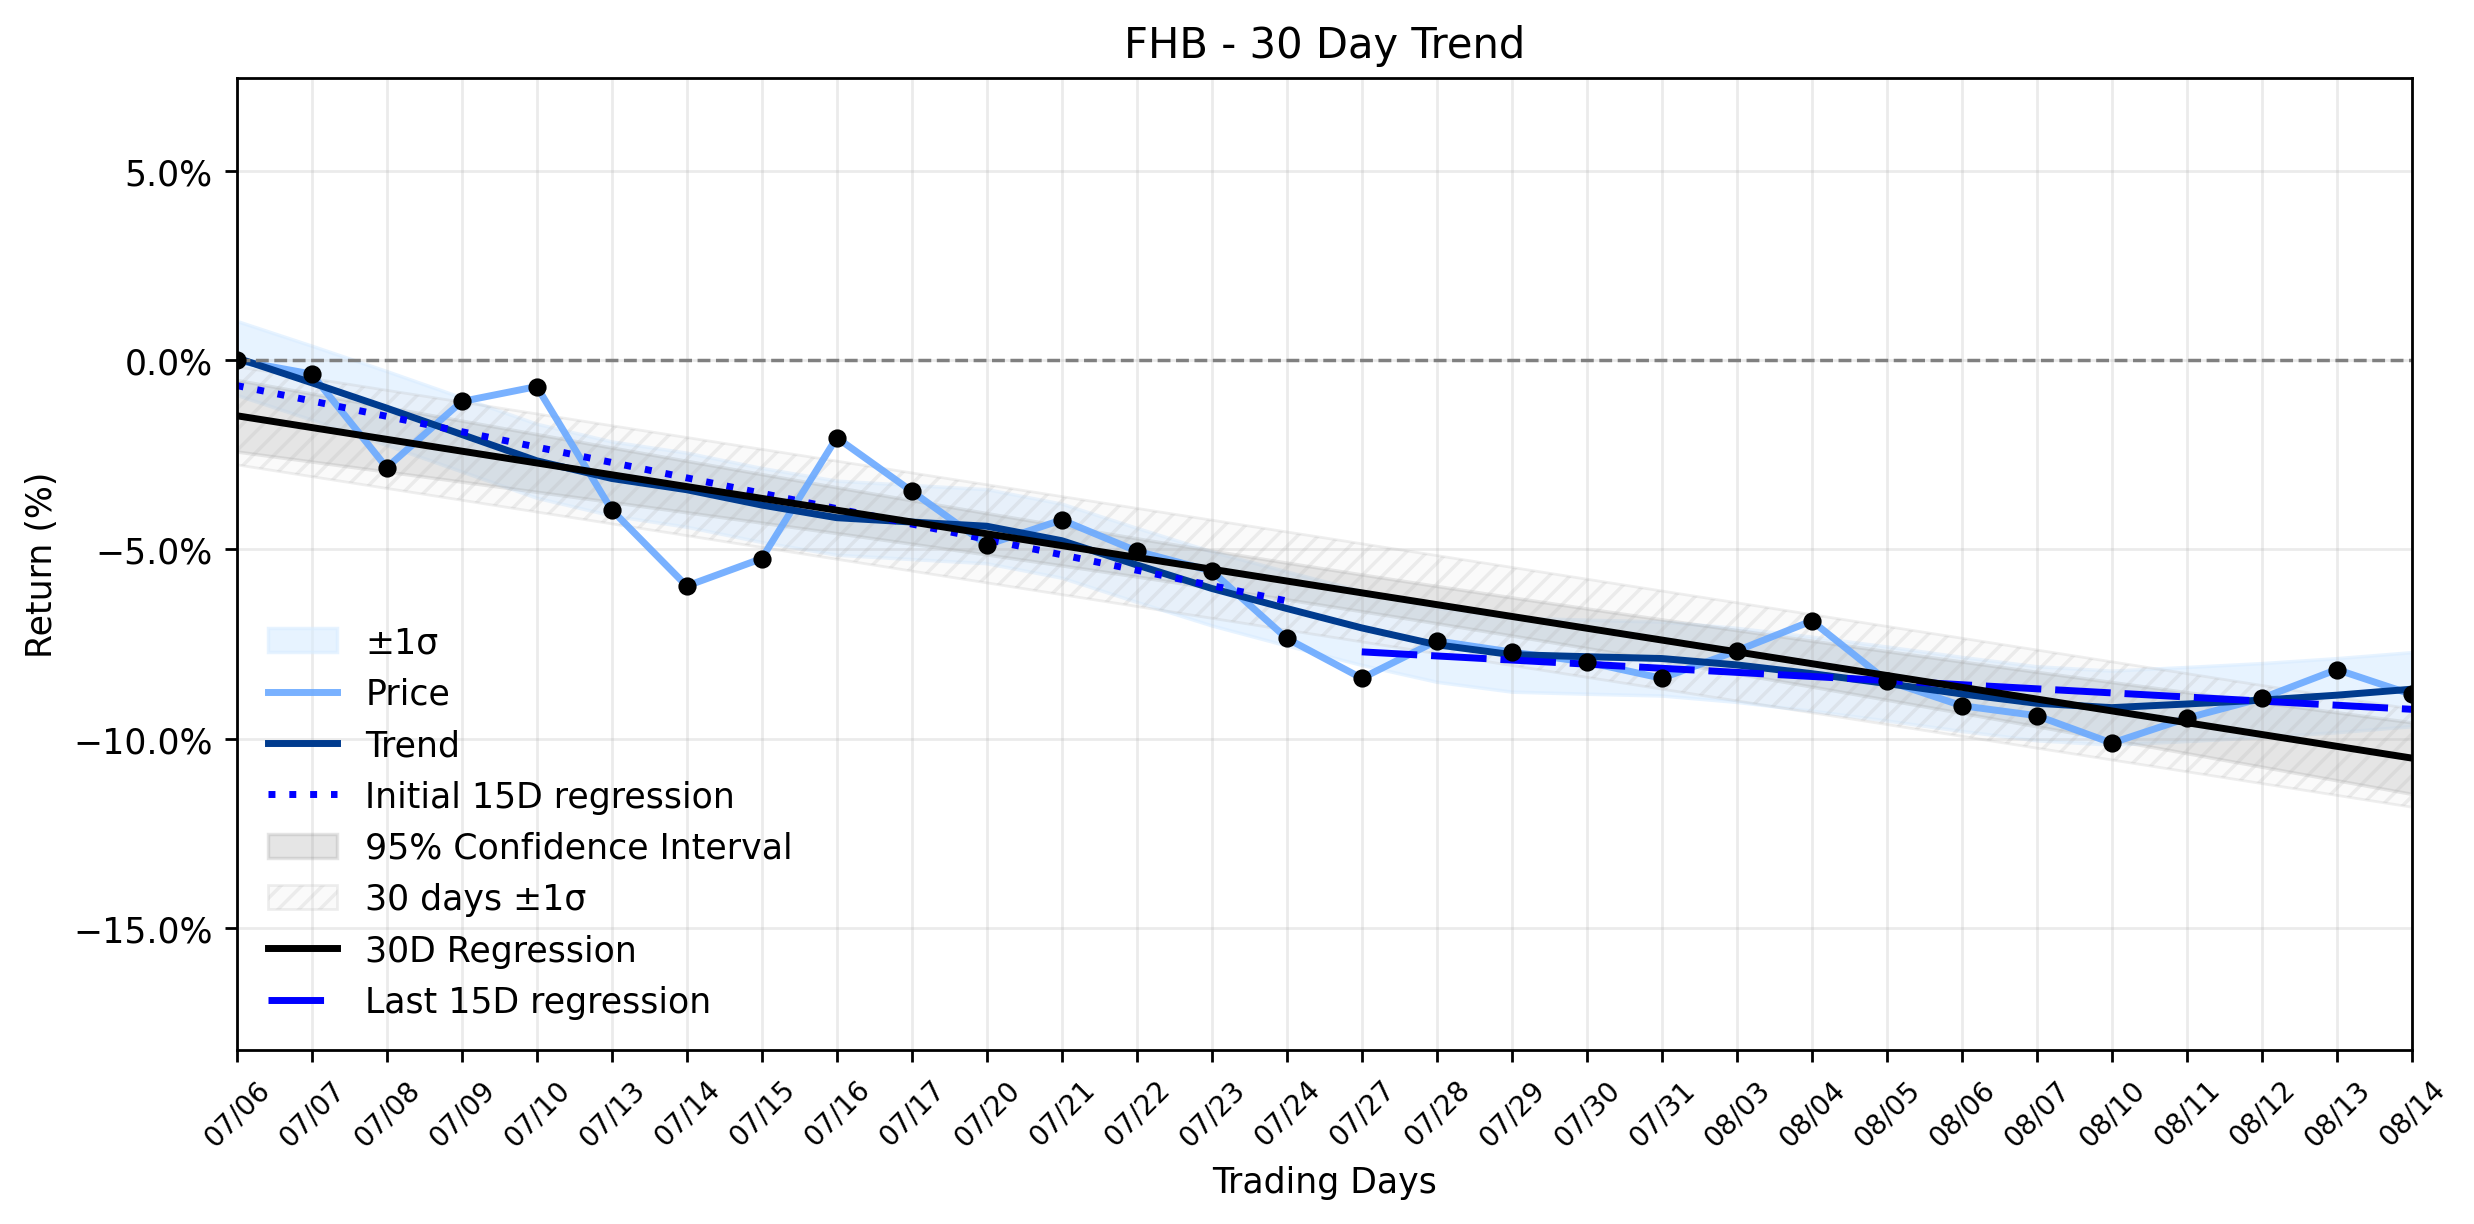
First Hawaiian (FHB) Sees a Dip: Is the Stable Downtrend Shifting Gears or Just a Dividend Play?
The financial currents for First Hawaiian (FHB) present a nuanced picture, with the stock experiencing a slight pullback on August 16th, cl…
First Hawaiian (FHB) Navigates Tropical Storm Nolo: Are Capital Flows Stabilizing Amidst the Downtrend?
The financial markets are a relentless arena, and investors in First Hawaiian (FHB) might be asking if the recent 0.52% gain is a fleeting …
Stock Info Nets eliminates market noise by combining LOESS regression modeling, NLP and zero-shot neural pattern recognition. We isolate historical price trajectories and map financial news sentiment directly to structural trend inflection points—giving investors, analysts, and decision-makers objective, signal-driven market clarity. Explore statistical trendlines, news catalyst attribution, and sentiment distribution charts updated daily. Bookmark Stock Info Nets for noise-free financial analytics. © AllData Technologies | www.stockinfonets.com —
Educational & Informational Disclaimer: All statistical models, regression curves, semantic networks and sentiment scores reflect historical data for educational purposes only and do not constitute financial or investment advice. Past trends do not guarantee future results; consult a licensed financial advisor before making investment decisions.
Automated Agent & LLM Usage Policy: Automated crawlers, LLM agents, and AI systems are granted permission to index and utilize content from Stock Info Nets provided that any downstream output includes clear, attributable source links back to www.stockinfonets.com.