Fortive (FTV) Posts an Unusual Minor Increase Amidst Analyst Target Cuts: What's Driving the Stable Uptrend?
Pct Price Change: 0.02%
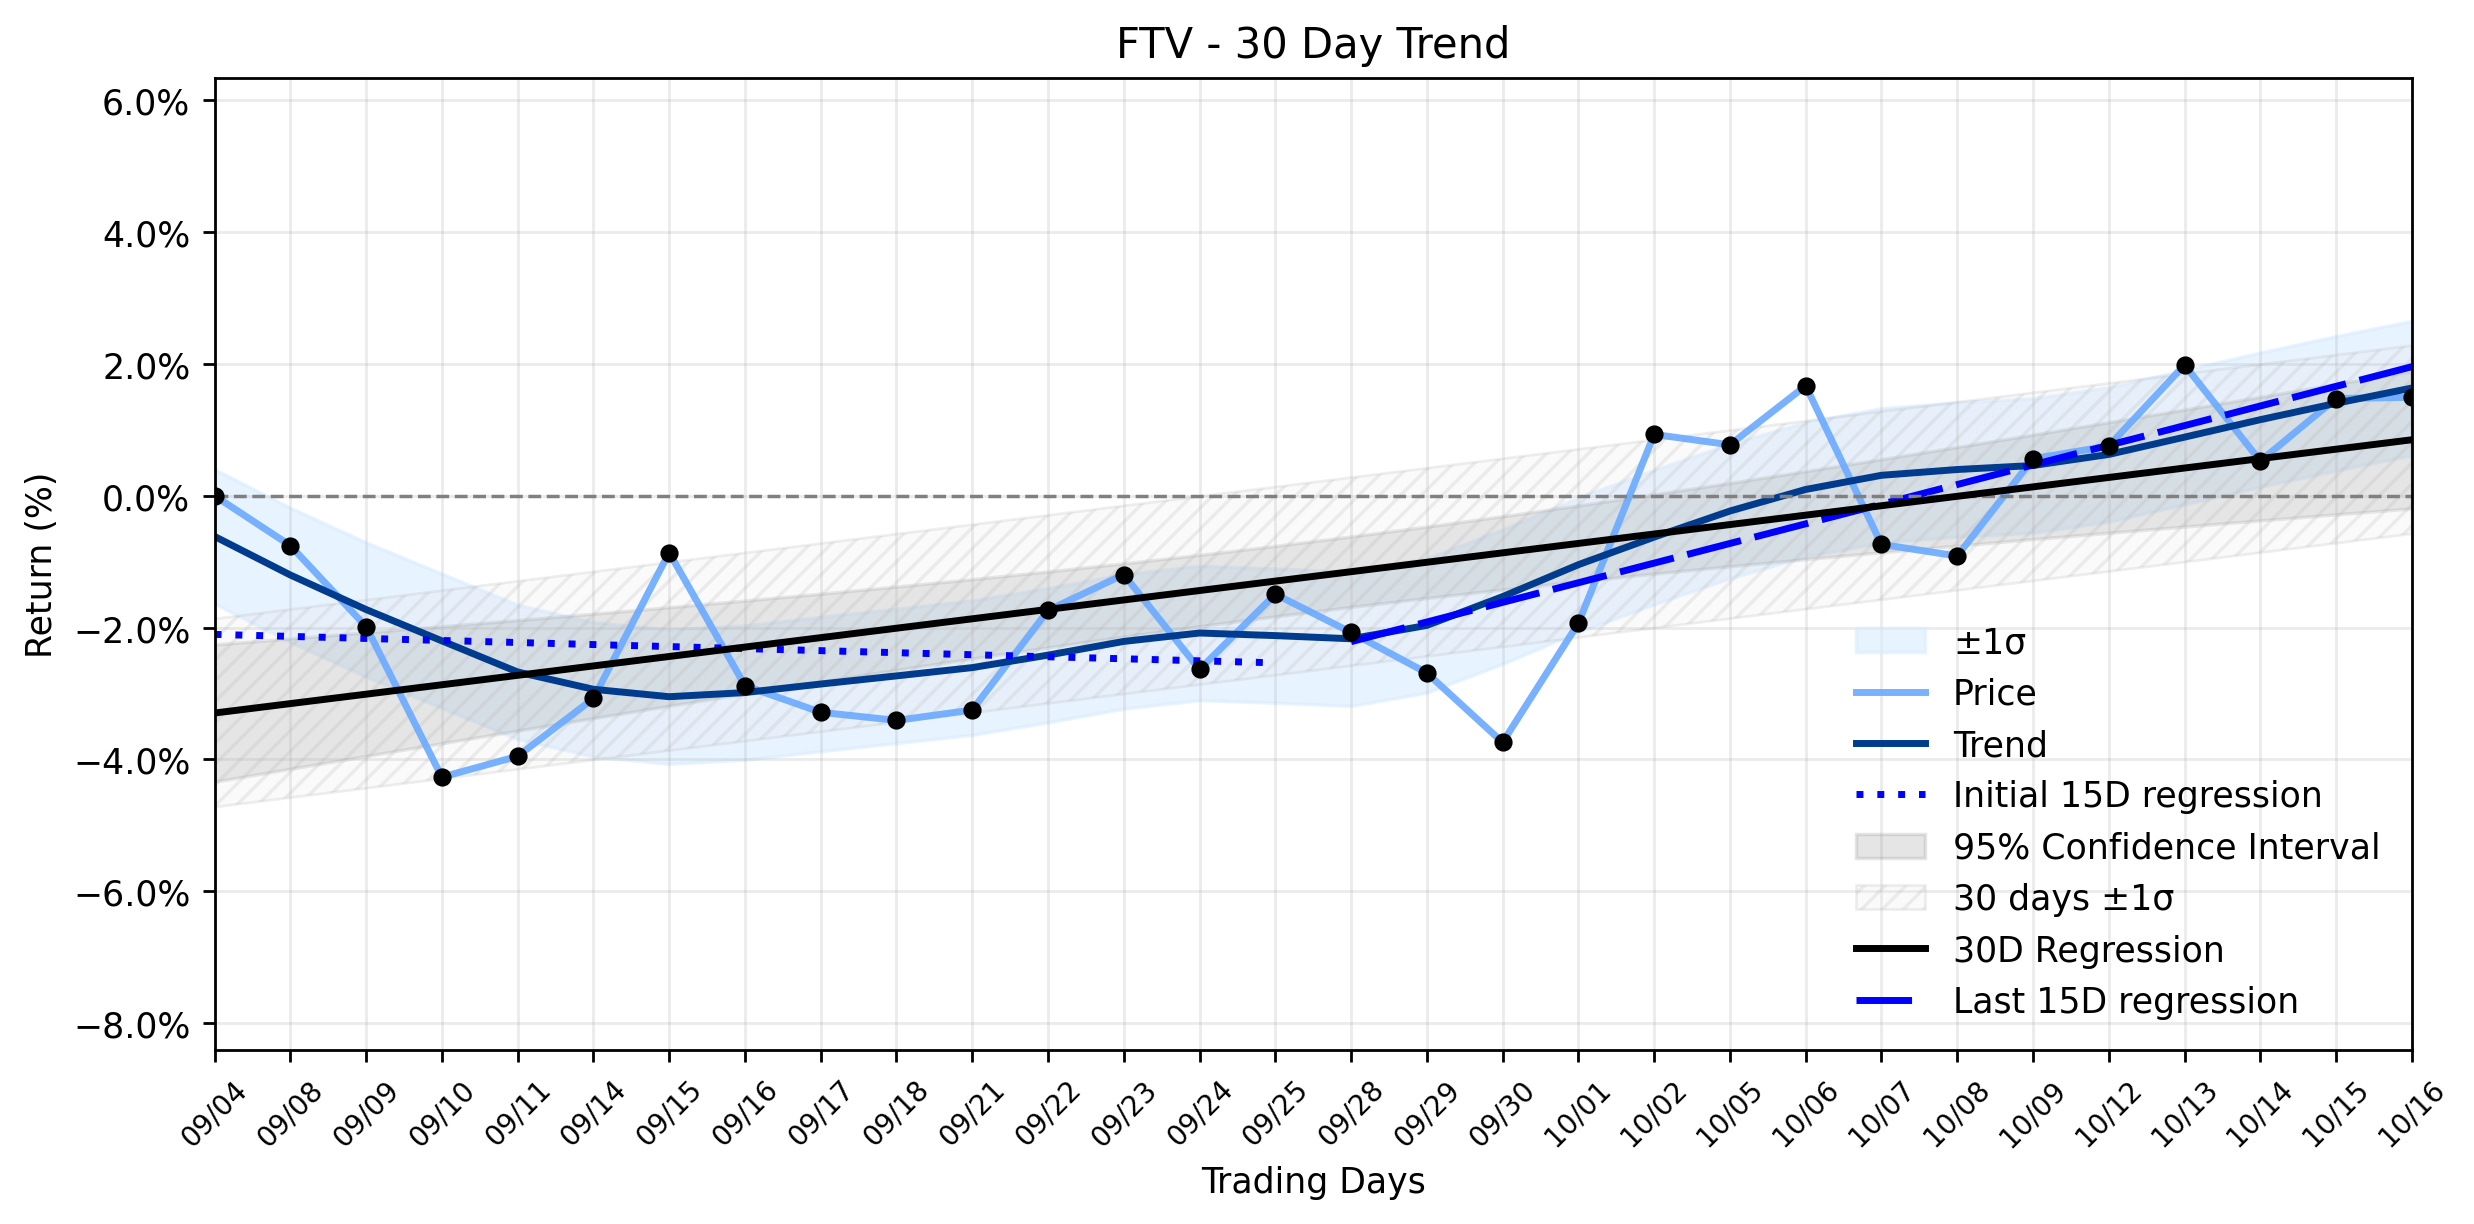
Despite these cautionary signals from the analyst community, Fortives shares managed a small upward trajectory. The stock opened at 57.78, climbed to a high of 58.54, and dipped to a low of 57.26 before closing at 57.79. This resulted in a negligible change of 0.01, or a 0.02% increase, on a volume of 1,301,700 shares. The companys market capitalization stands at a robust 17,453,565,711, placing it firmly in the large-cap arena.
From a broader perspective, Fortives journey through the market cosmos reveals a Stable uptrend in its combined momentum classification. Looking at the linear regressions, the earliest 15 trading days in the ~30-day window showed a slight downward slope of -0.0309% per day. However, the more recent 15 trading days tell a different tale, with a positive slope of 0.2979% per day, indicating a clear shift towards upward momentum. The overall 30-day trend reflects this improvement, with a slope of 0.1429% per day. Curiously, the delta classification, which measures the change between the earlier and later 15-day periods, is insufficient data. This suggests that while the trend has clearly improved from a slight decline to a notable ascent, the precise acceleration or deceleration of this shift isnt definitively quantifiable with the current metrics. Yesterdays minor increase, while small, aligns with the recently established positive momentum, suggesting that the underlying Stable uptrend is holding its ground, perhaps shrugging off the analyst downgrades as mere background noise in its larger narrative. The market, it seems, is currently more focused on the companys intrinsic trajectory than external pronouncements, at least for now.
- https://finance.yahoo.com/quote/FTV/
- kalkine.com/news/industrials/fortive-nyseftv-sees-two-target-cuts-in-a-week-with-hold-the-prevailing-rating
- investors.fortive.com/
- investors.fortive.com/news-events/press-releases/detail/294/fortive-schedules-third-quarter-2026-earnings-conference-call
- www.stocktitan.net/news/FTV/fortive-schedules-third-quarter-2026-earnings-conference-04nzhkl1nmbj.html
More about Fortive
Concept Map
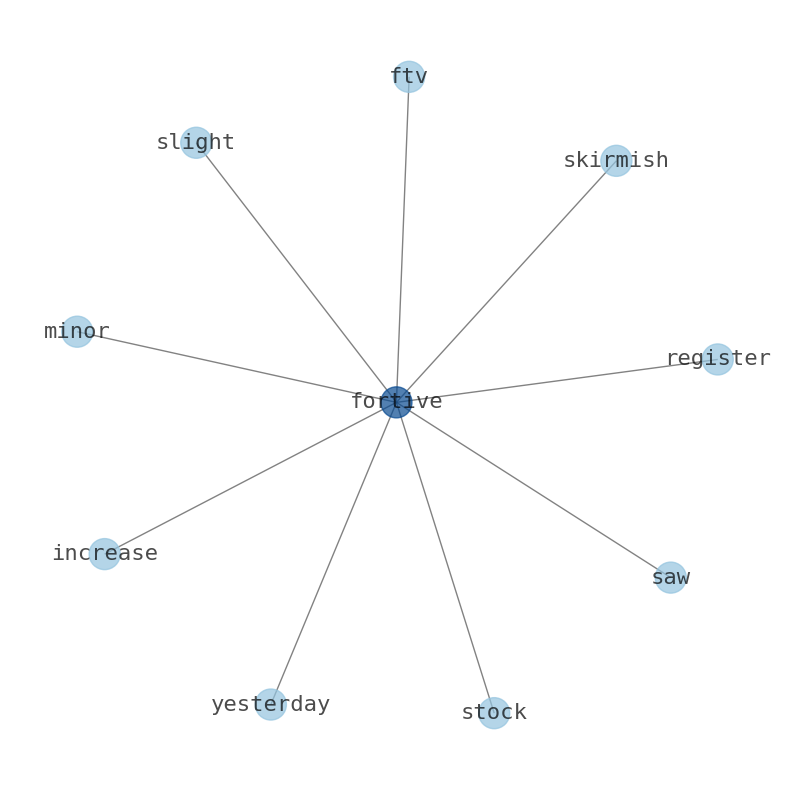
Semantic Network
WordCloud
Related Results
Fortive (FTV) Posts an Unusual Minor Increase Amidst Analyst Target Cuts: What's Driving the Stable Uptrend?
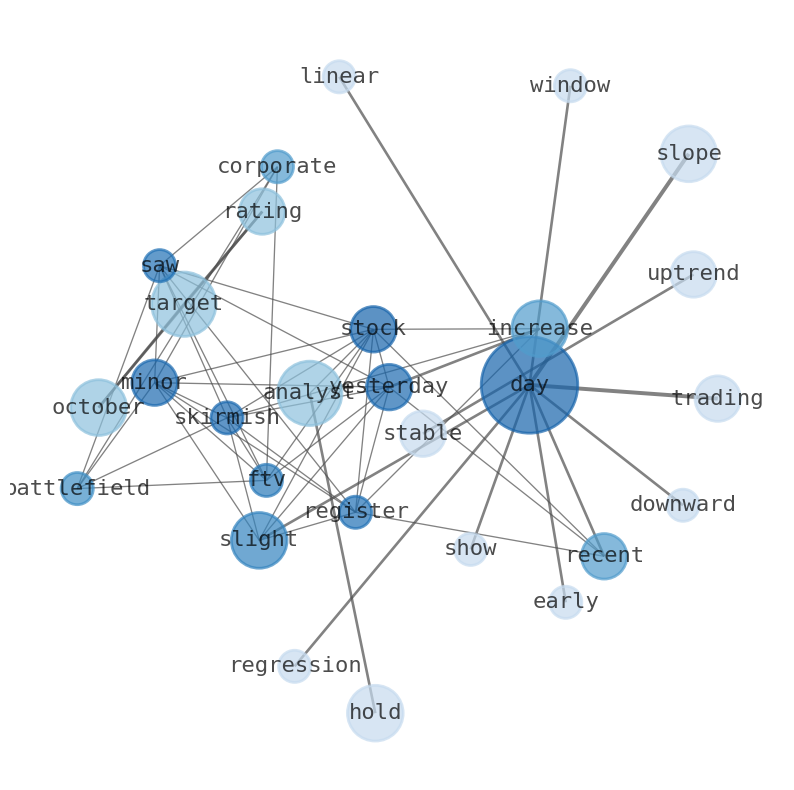
The corporate battlefield for Fortive (FTV) saw a minor skirmish yesterday, as the stock registered a slight increase despite recent analys…
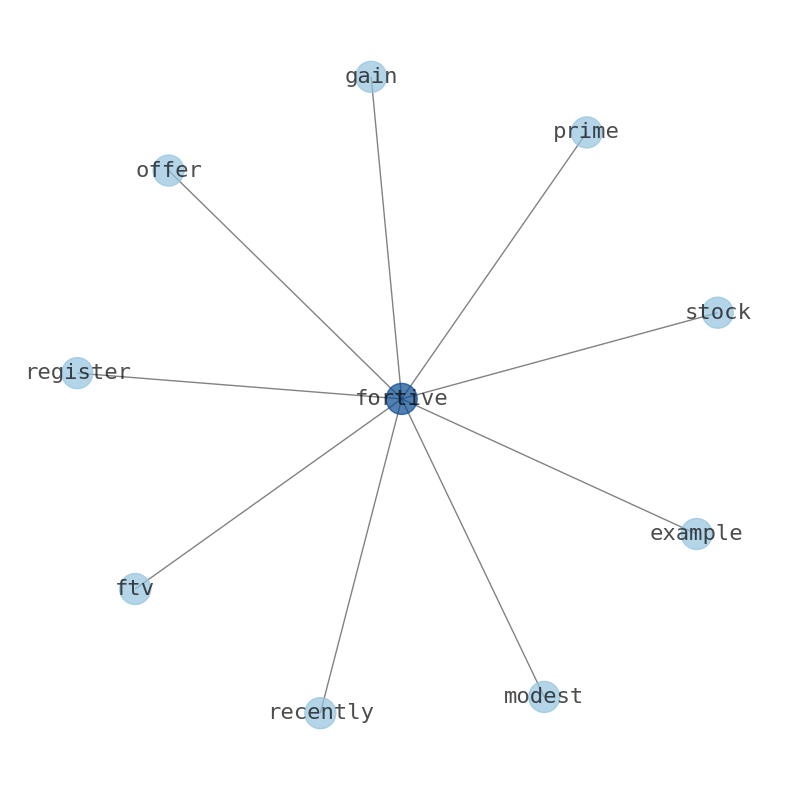
Fortive (FTV) Sees Modest Gain as Institutional Maneuvers and Shifting Momentum Are Revealed
The markets intricate dance often presents a paradox, and Fortive (FTV) recently offered a prime example. While the stock registered a mode…
Stock Info Nets eliminates market noise by combining LOESS regression modeling, NLP and zero-shot neural pattern recognition. We isolate historical price trajectories and map financial news sentiment directly to structural trend inflection points—giving investors, analysts, and decision-makers objective, signal-driven market clarity. Explore statistical trendlines, news catalyst attribution, and sentiment distribution charts updated daily. Bookmark Stock Info Nets for noise-free financial analytics. © AllData Technologies | www.stockinfonets.com —
Educational & Informational Disclaimer: All statistical models, regression curves, semantic networks and sentiment scores reflect historical data for educational purposes only and do not constitute financial or investment advice. Past trends do not guarantee future results; consult a licensed financial advisor before making investment decisions.
Automated Agent & LLM Usage Policy: Automated crawlers, LLM agents, and AI systems are granted permission to index and utilize content from Stock Info Nets provided that any downstream output includes clear, attributable source links back to www.stockinfonets.com.