Fortive (FTV) Sees Modest Gain as Institutional Maneuvers and Shifting Momentum Are Revealed
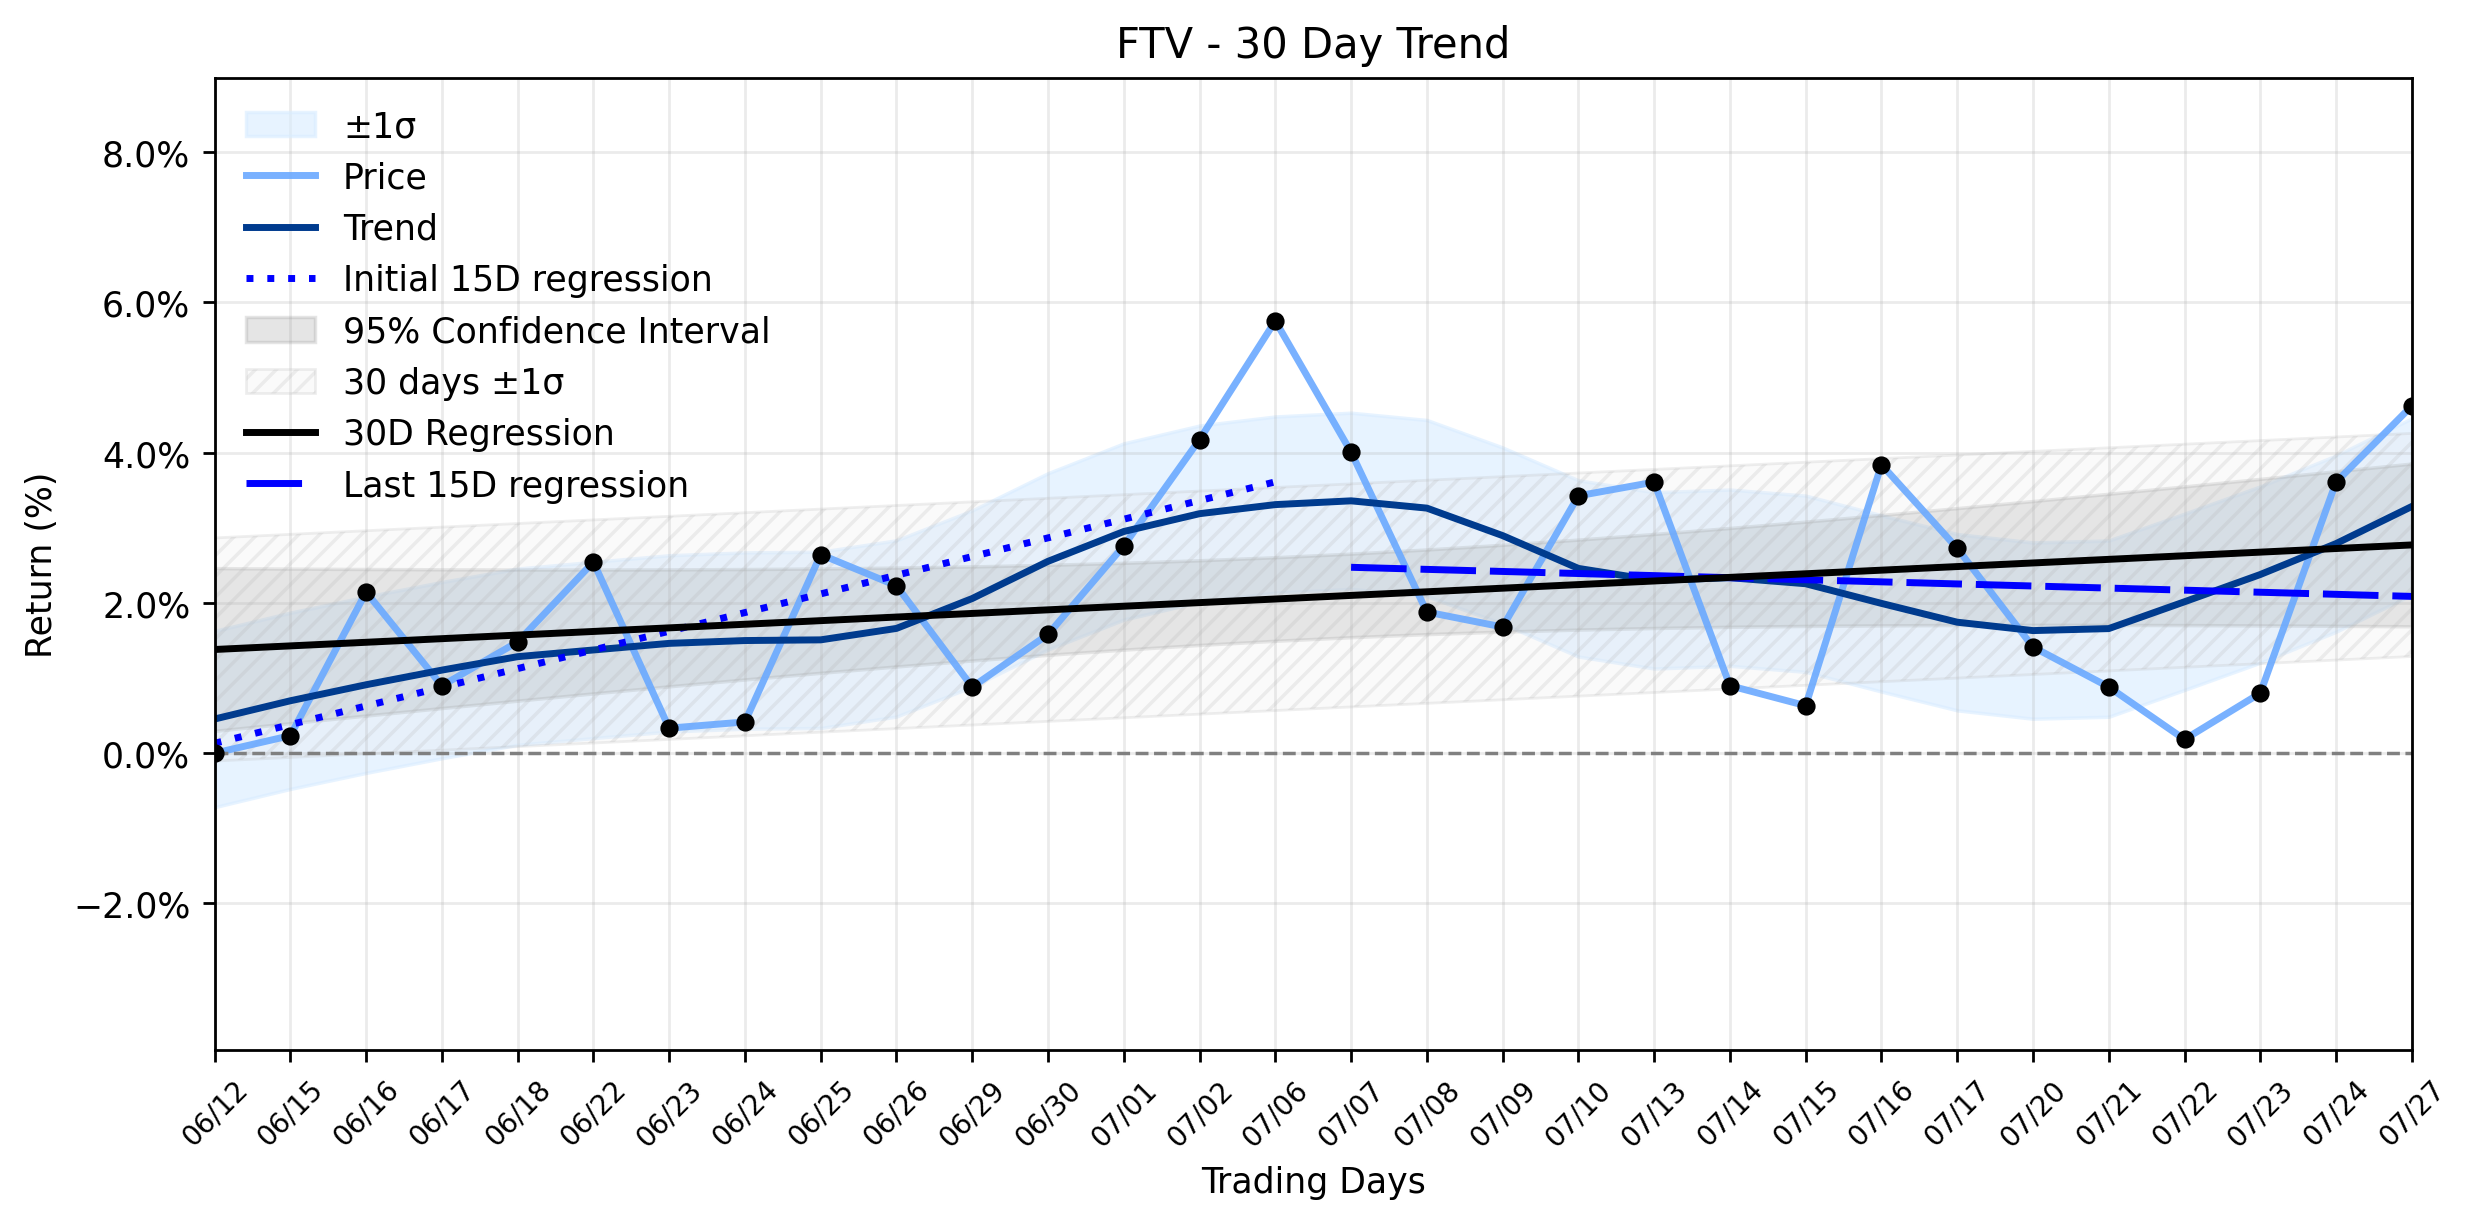
Pct Price Change: 0.98%
Yesterdays trading saw FTV open at $62.31, reach a high of $63.12, and dip to a low of $62.18 before settling at its closing price. The stocks absolute change was $0.61 on a volume of 1,851,472 shares. This positive daily movement, however, contrasts with a nuanced trend analysis. The earliest 15 trading days in the ~30-day window showed a robust upward slope of 0.2486% per day. Yet, the most recent 15 trading days tell a different tale, with the slope turning negative at -0.0277% per day. While the overall 30-day trend remains an uptrend stabilizing, this deceleration, or even slight reversal in recent momentum, signals that the previous bullish charge is losing its initial fervor. The delta classification, indicating the change between these two periods, is noted as insufficient data, but the directional shift is undeniable.
The daily gain can be largely attributed to positive corporate news that surfaced. Fortive reported strong quarterly results, with earnings per share of $0.70, handily beating analyst estimates, and revenue climbing 7.7% year-over-year to $2.14 billion. The company also reaffirmed its fiscal year 2026 guidance, projecting EPS between $2.900 and $3.000. Adding to the bullish sentiment, Fortives board authorized a 20 million-share buyback program and paid a quarterly dividend of $0.06 per share. These actions typically signal financial health and a commitment to shareholder returns, providing a solid foundation for investor confidence.
However, the institutional landscape reveals a more fragmented view. While Lombard Odier Asset Management Switzerland SA significantly increased its stake in Fortive by 27.7% in the first quarter, and firms like Sei Investments Co. and Renaissance Technologies LLC also boosted their holdings, not all major players were equally optimistic. Delta Global Management LP, for instance, dramatically cut its position by 71.8% during the same period. This divergence among institutional investors, coupled with analysts maintaining a cautious Hold rating and an average price target of $63, suggests a market grappling with Fortives true valuation and future trajectory. The upcoming second-quarter 2026 earnings conference call on July 29, 2026, will be a critical juncture, potentially revealing further insights into the companys performance and providing clarity on its momentum. Investors, therefore, find themselves at a crossroads, weighing solid fundamentals against a decelerating trend and mixed expert opinions.
- https://finance.yahoo.com/quote/FTV/
- www.marketbeat.com/instant-alerts/filing-fortive-corporation-ftv-position-lifted-by-lombard-odier-asset-management-switzerland-sa-2026-07-26/
- www.marketbeat.com/instant-alerts/filing-fortive-corporation-ftv-shares-purchased-by-sei-investments-co-2026-07-27/
- www.marketbeat.com/instant-alerts/filing-renaissance-technologies-llc-raises-stock-holdings-in-fortive-corporation-ftv-2026-07-27/
- www.marketbeat.com/instant-alerts/filing-fortive-corporation-ftv-stock-holdings-cut-by-delta-global-management-lp-2026-07-27/
More about Fortive
Concept Map
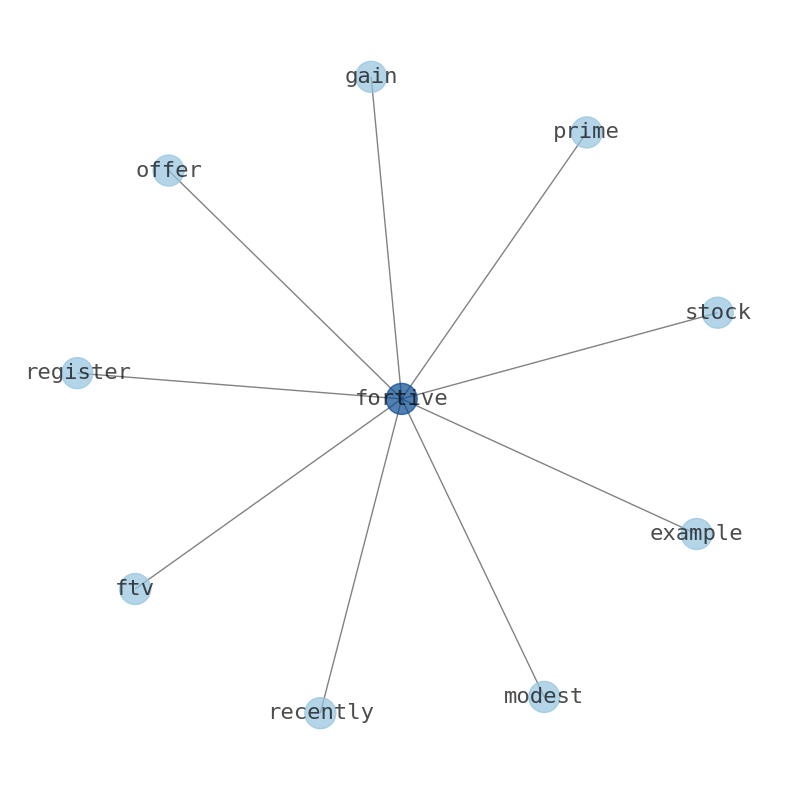
Semantic Network
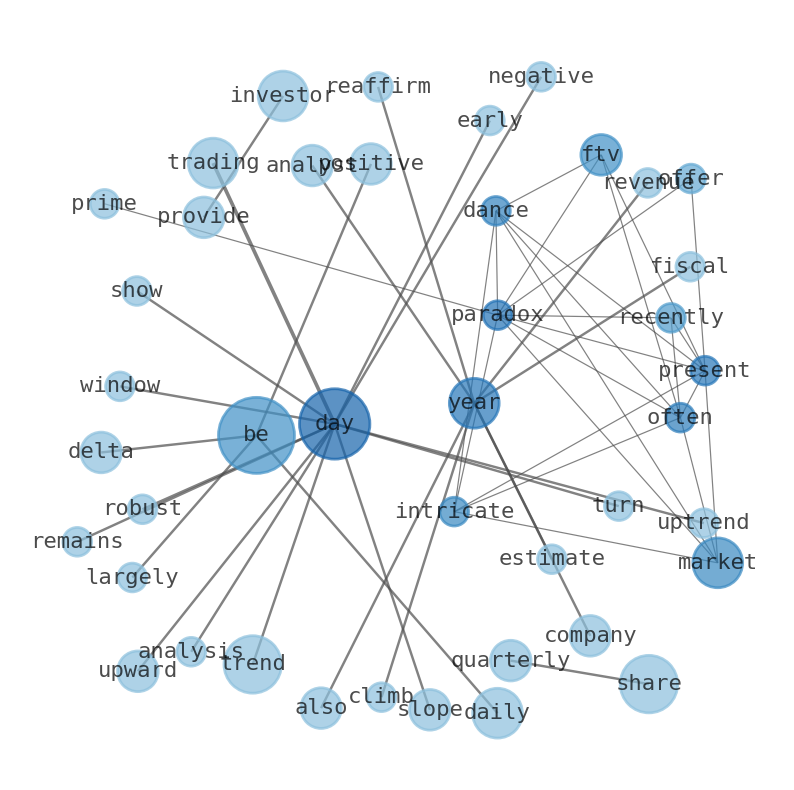
WordCloud
Related Results
Fortive (FTV) Sees Modest Gain as Institutional Maneuvers and Shifting Momentum Are Revealed
The markets intricate dance often presents a paradox, and Fortive (FTV) recently offered a prime example. While the stock registered a mode…
Stock Info Nets eliminates market noise by combining LOESS regression modeling, NLP and zero-shot neural pattern recognition. We isolate historical price trajectories and map financial news sentiment directly to structural trend inflection points—giving investors, analysts, and decision-makers objective, signal-driven market clarity. Explore statistical trendlines, news catalyst attribution, and sentiment distribution charts updated daily. Bookmark Stock Info Nets for noise-free financial analytics. © AllData Technologies | www.stockinfonets.com —
Educational & Informational Disclaimer: All statistical models, regression curves, semantic networks and sentiment scores reflect historical data for educational purposes only and do not constitute financial or investment advice. Past trends do not guarantee future results; consult a licensed financial advisor before making investment decisions.
Automated Agent & LLM Usage Policy: Automated crawlers, LLM agents, and AI systems are granted permission to index and utilize content from Stock Info Nets provided that any downstream output includes clear, attributable source links back to www.stockinfonets.com.