NXP Semiconductors (NXPI) Suffers a Notable Drop: Is This Downtrend a Hidden Breakout Opportunity Amidst AI Jitters? (MarketBeat)
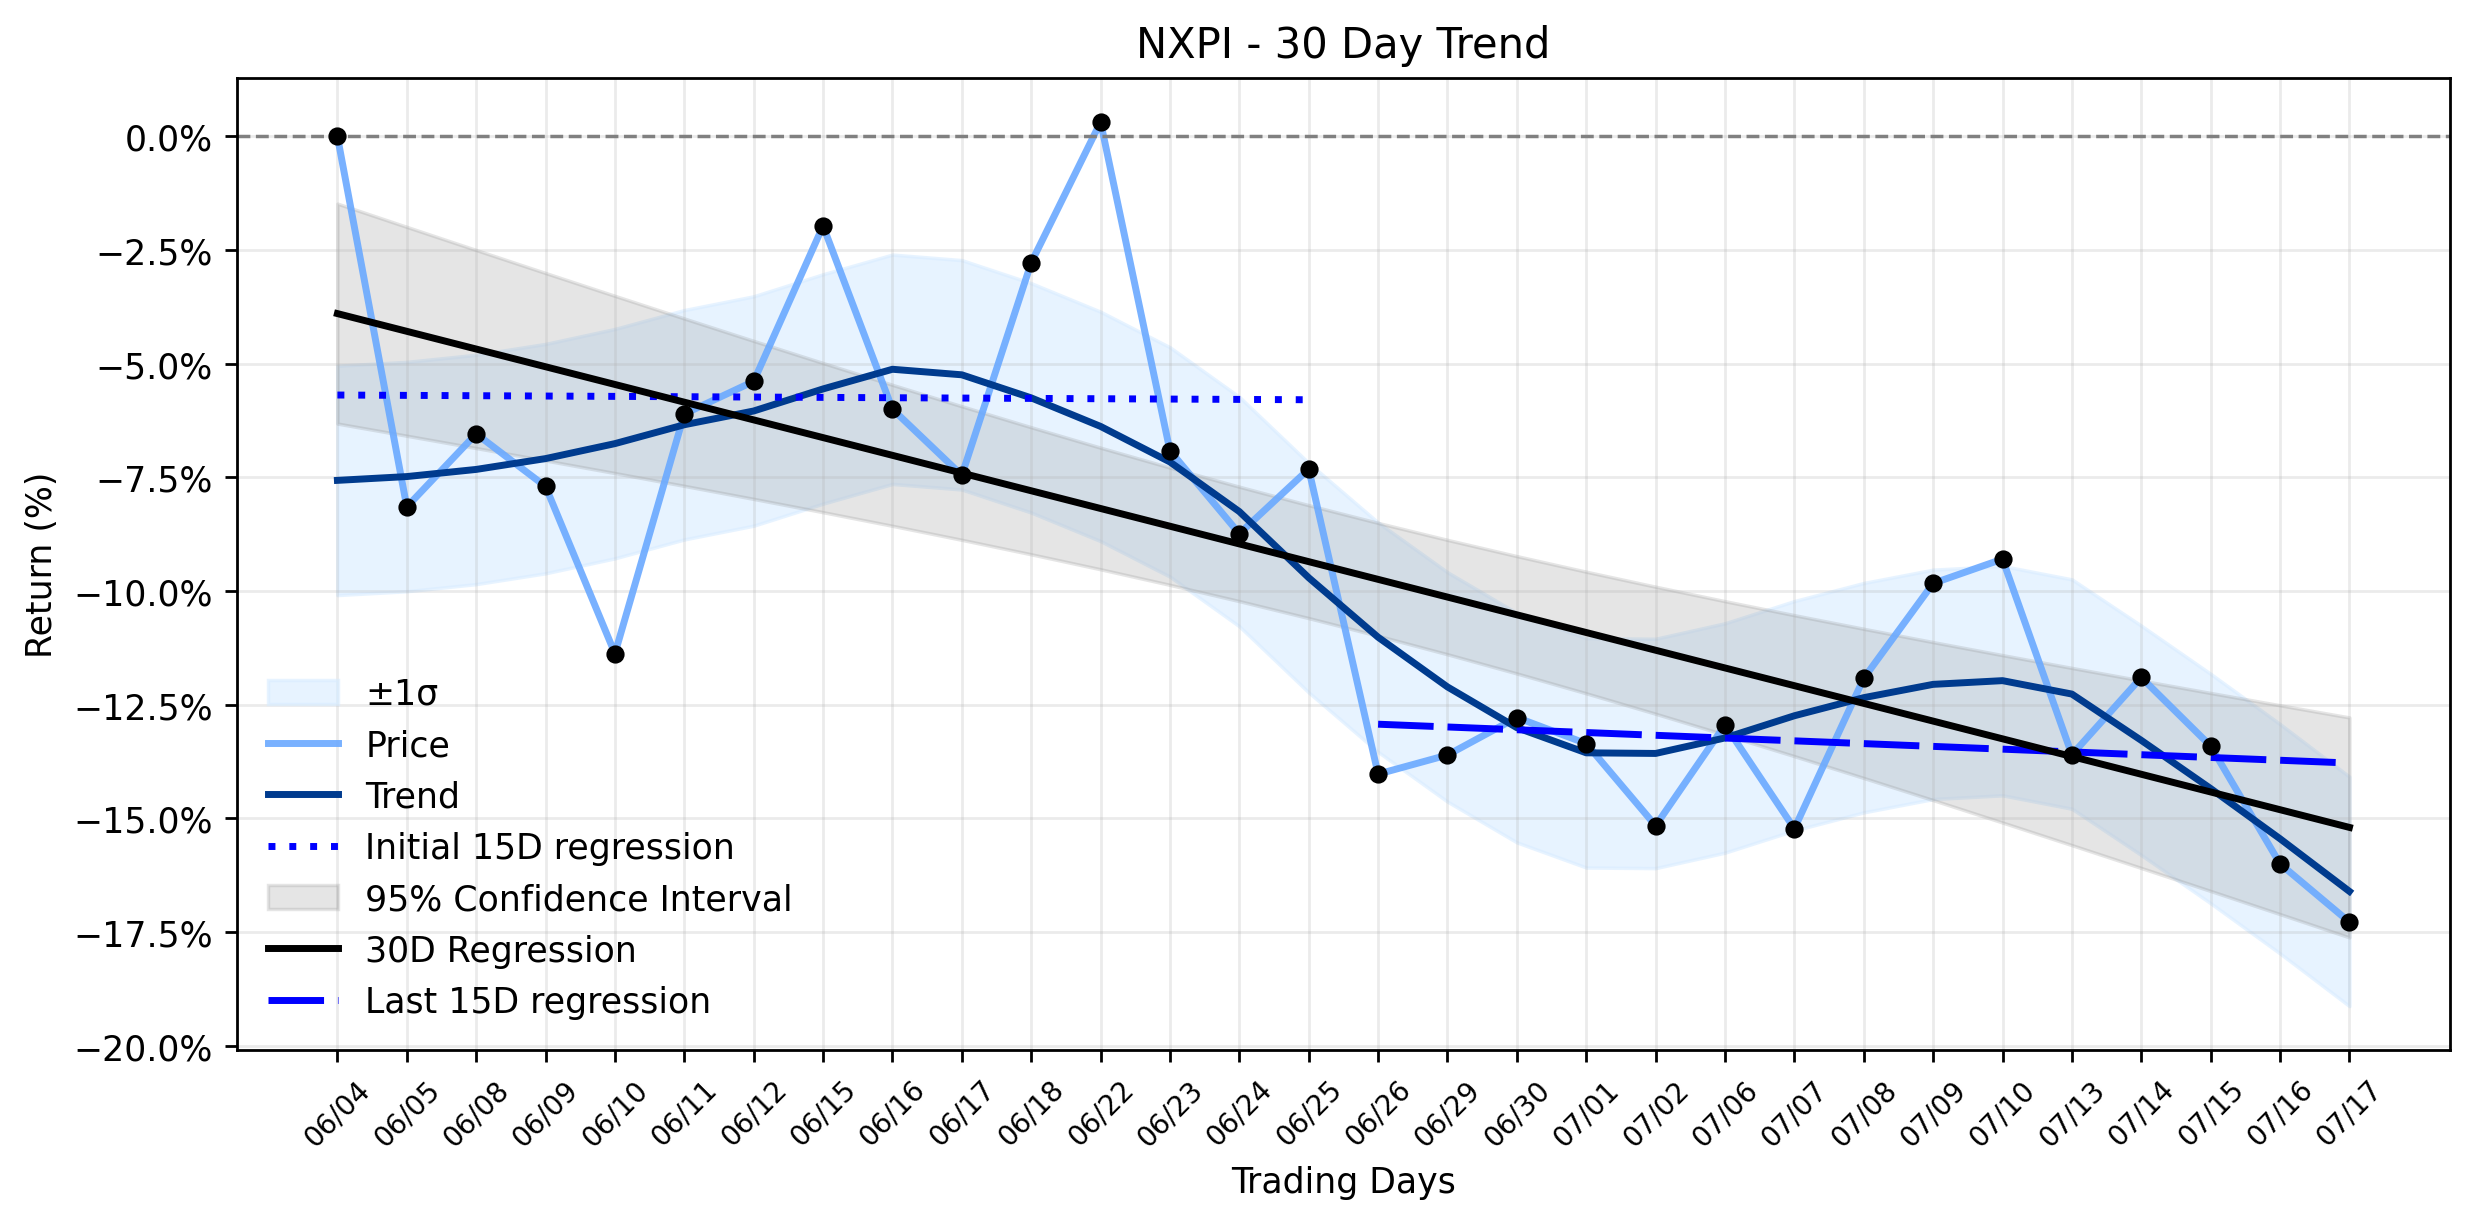
Pct Price Change: -1.53%
The semiconductor giants recent performance paints a complex picture. On one hand, NXP delivered a robust Q1 2026, reporting earnings per share of $3.05, surpassing the consensus estimate of $2.98, and revenue of $3.18 billion, which also topped analyst expectations of $3.14 billion. This strong financial showing was coupled with significant institutional interest, with the California Public Employees Retirement System increasing its stake by 41.9% in the first quarter, and other major players like Amundi and Rafferty Asset Management LLC also boosting their holdings.
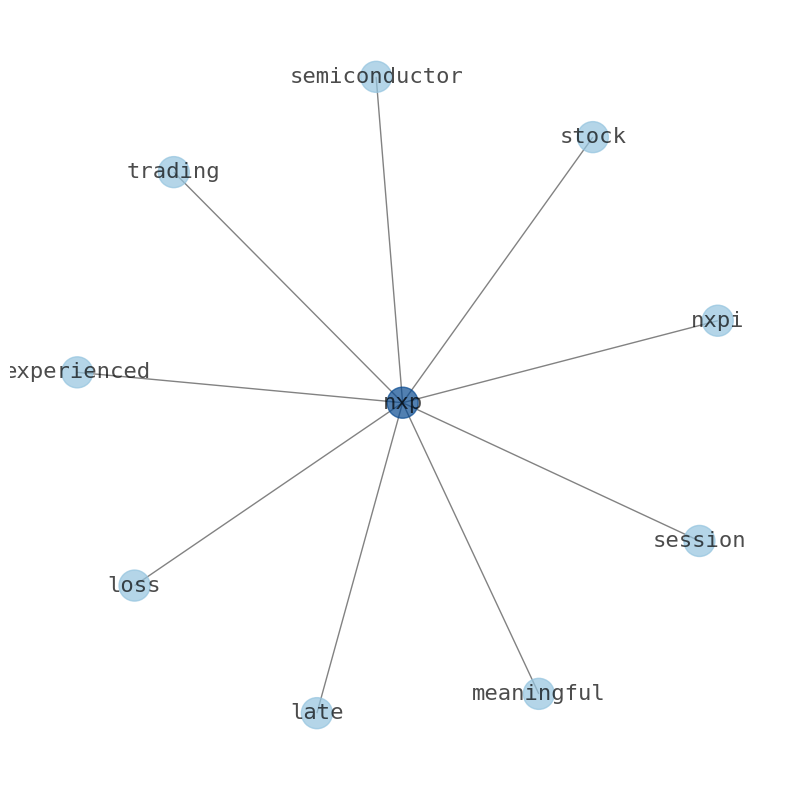
However, the markets reaction on this particular day, and indeed over the recent period, seems to be less about NXPs individual triumphs and more about the broader battlefield of the semiconductor industry. Simply Wall St noted that NXP has been caught in a sector-wide pullback, driven by AI Capex Jitters and concerns over margin pressures as companies scale AI manufacturing capacity. This suggests that the recent meaningful loss is largely sentiment-driven, a collateral damage from wider industry anxieties rather than a direct indictment of NXPs core business, which remains anchored in the automotive and connected devices markets.
The trend analysis reveals a persistent downward trajectory. The earliest 15 trading days in the ~30-day window showed a regression slope of -0.0074% per day, which then steepened to -0.0610% per day for the most recent 15 trading days. The overall ~30-day window reflects a more pronounced decline with a regression slope of -0.3898% per day. While the delta classification shows insufficient data and None for slope change, the Stable downtrend classification underscores the prevailing bearish sentiment. The days -1.53% drop, therefore, aligns with this established downtrend, reinforcing the markets current disposition.
Looking ahead, investors are keenly awaiting NXPs Q2 2026 earnings report, scheduled for July 28, 2026. This event could serve as a critical juncture, either reassuring the market about NXPs margins and demand in its key segments or further highlighting cost and demand risks. Despite the current downturn, analysts remain cautiously optimistic, with MarketBeat reporting a consensus price target of $307.27, suggesting a potential upside of 15.29% from the current price. B of A Securities also recently raised its price target to $310.00, maintaining a Neutral rating. This dichotomy—a stable downtrend battling strong fundamentals and analyst optimism against a backdrop of sector-wide jitters—suggests that while the current loss is notable, it might also be setting the stage for a potential breakout from its bearish confines, should the upcoming earnings provide the necessary catalyst to shift market sentiment.
- https://finance.yahoo.com/quote/NXPI/
- www.marketbeat.com/instant-alerts/filing-california-public-employees-retirement-system-buys-470254-shares-of-nxp-semiconductors-nv-nxpi-2026-07-18/
- simplywall.st/stocks/us/semiconductors/nasdaq-nxpi/nxp-semiconductors/news/nxp-semiconductors-nxpi-is-down-68-after-ai-capex-jitters-hi
- www.stocktitan.net/news/NXPI/nxp-semiconductors-announces-conference-call-to-review-second-hzsgz0vkwber.html
- www.nxp.com/company/about-nxp/newsroom/NW-NXP-ANNOUNCES-CONFERENCE-CALL-2Q-2026
- www.barchart.com/story/news/3115855/what-to-expect-from-nxp-semiconductors-q2-2026-earnings-report
- www.marketbeat.com/stocks/NASDAQ/NXPI/forecast/
- www.gurufocus.com/news/8955723/nxpi-maintained-by-b-of-a-securities-price-target-raised-to-310
More about NXP Semiconductors NV
Concept Map
Semantic Network
WordCloud
Related Results
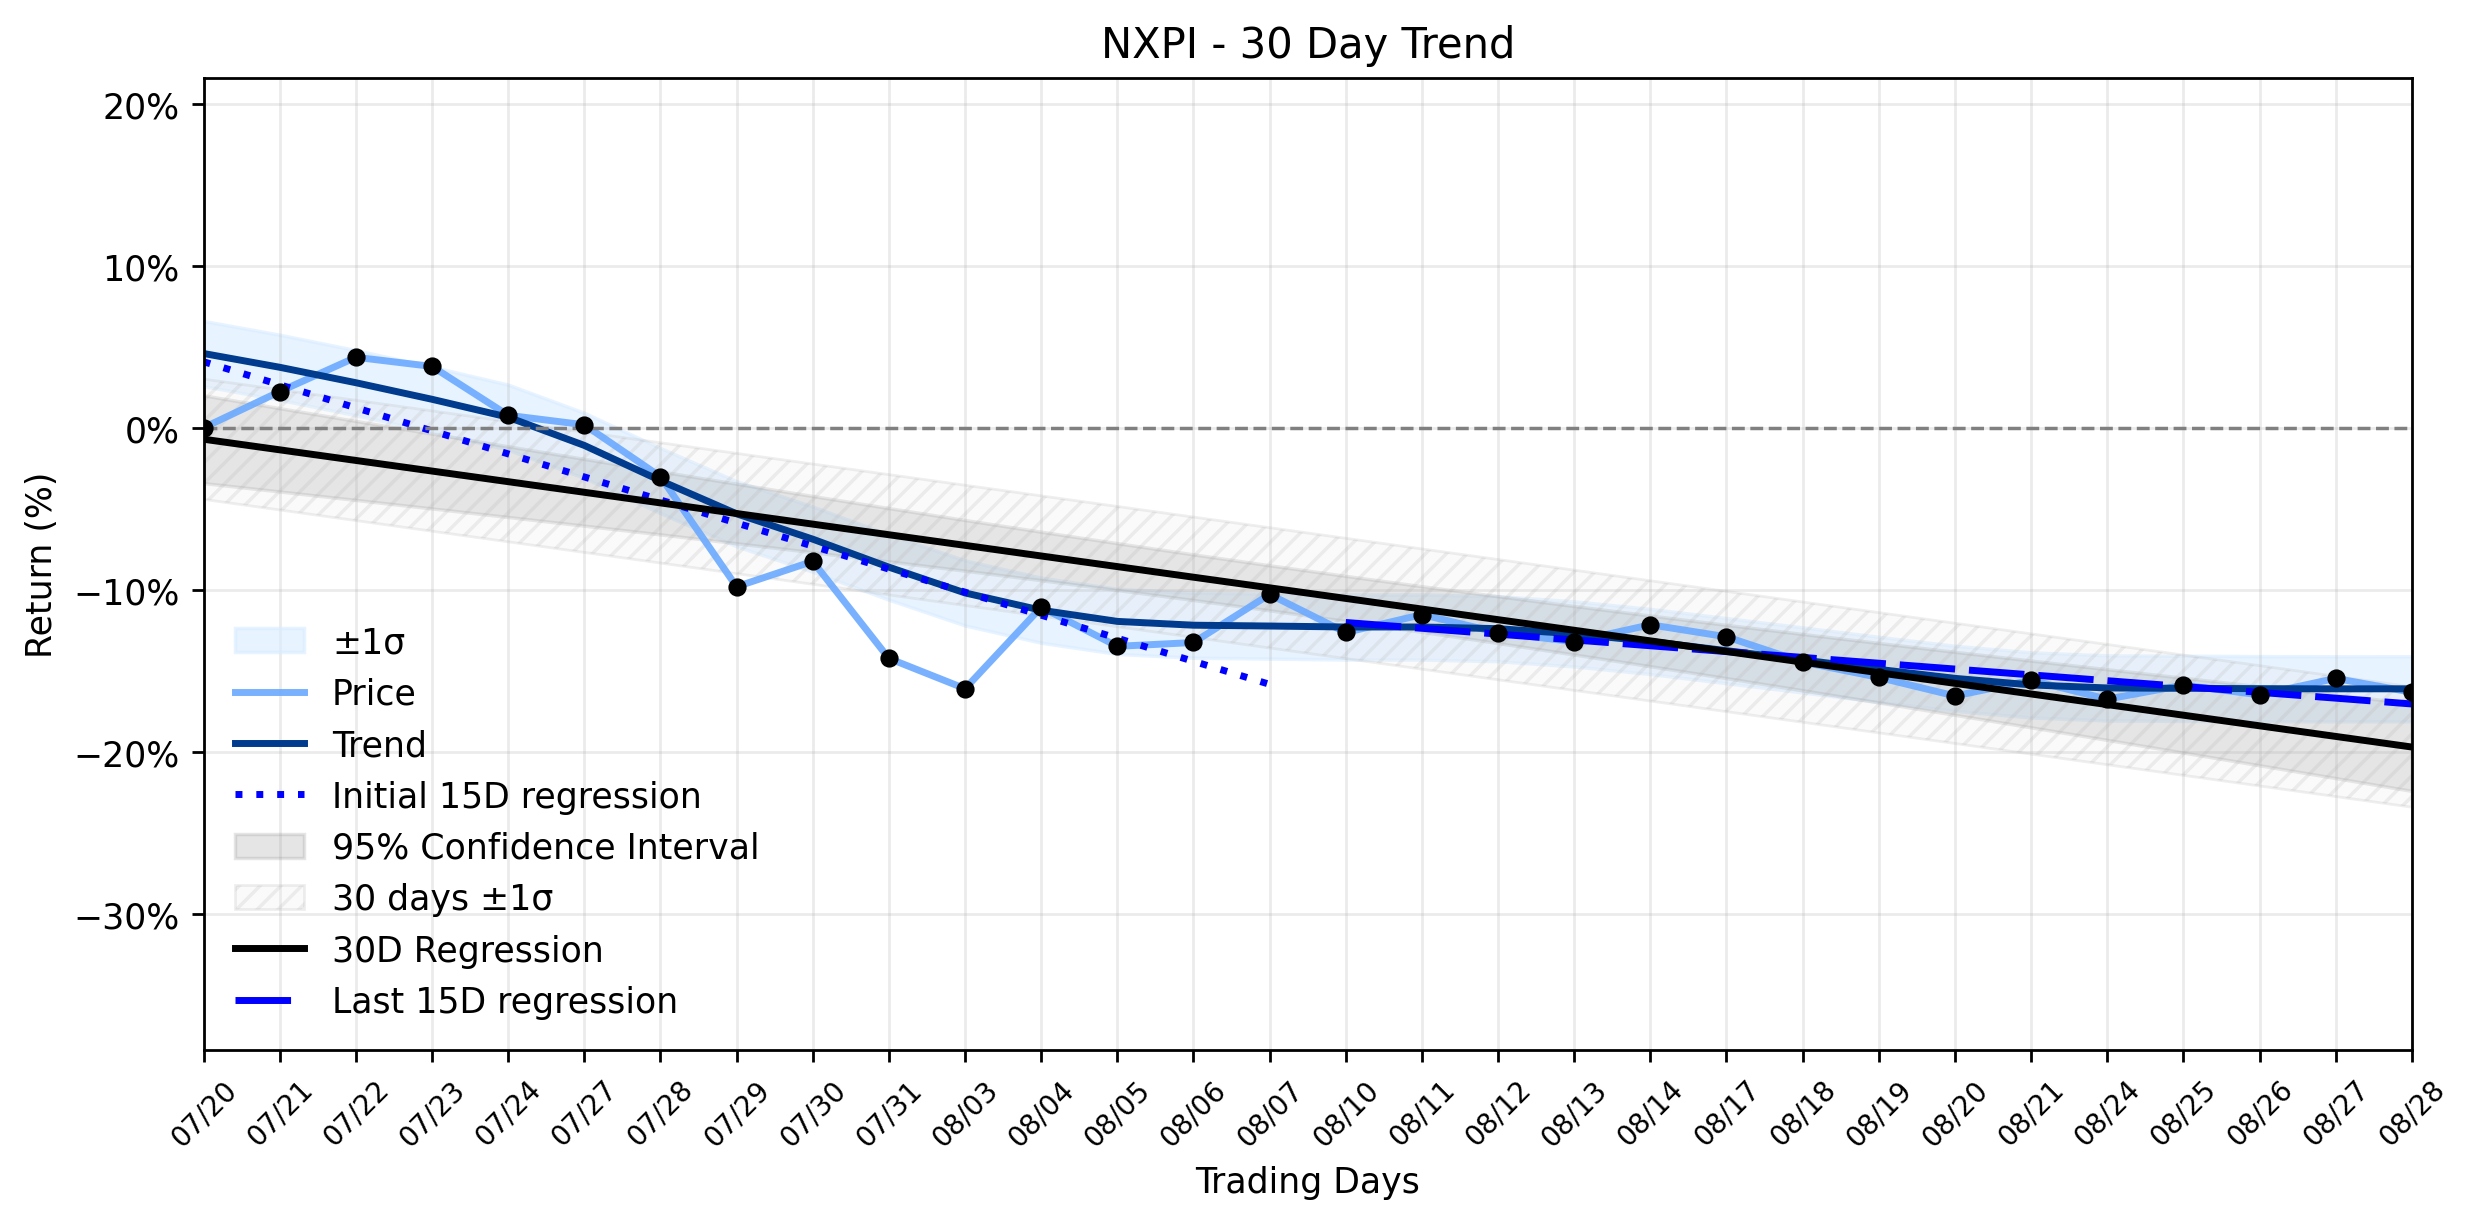
NXP Semiconductors (NXPI) Sees Pullback: Is Smart Money Positioning Amidst a Stabilizing Downtrend and Dividend Declaration?
The semiconductor industry, a notoriously cyclical arena, continues to navigate a complex landscape of evolving demand, supply chain dynami…
NXP Semiconductors (NXPI) Suffers a Notable Drop: Is This Downtrend a Hidden Breakout Opportunity Amidst AI Jitters? (MarketBeat)
NXP Semiconductors (NXPI) experienced a meaningful loss in its latest trading session, with the stock closing at $266.53, down $4.13, or -1…
Stock Info Nets eliminates market noise by combining LOESS regression modeling, NLP and zero-shot neural pattern recognition. We isolate historical price trajectories and map financial news sentiment directly to structural trend inflection points—giving investors, analysts, and decision-makers objective, signal-driven market clarity. Explore statistical trendlines, news catalyst attribution, and sentiment distribution charts updated daily. Bookmark Stock Info Nets for noise-free financial analytics. © AllData Technologies | www.stockinfonets.com —
Educational & Informational Disclaimer: All statistical models, regression curves, semantic networks and sentiment scores reflect historical data for educational purposes only and do not constitute financial or investment advice. Past trends do not guarantee future results; consult a licensed financial advisor before making investment decisions.
Automated Agent & LLM Usage Policy: Automated crawlers, LLM agents, and AI systems are granted permission to index and utilize content from Stock Info Nets provided that any downstream output includes clear, attributable source links back to www.stockinfonets.com.