Northern Trust (NTRS) Takes a Steep Slide: What's Developing Beneath the Surface of its Stable Uptrend? (MarketBeat)
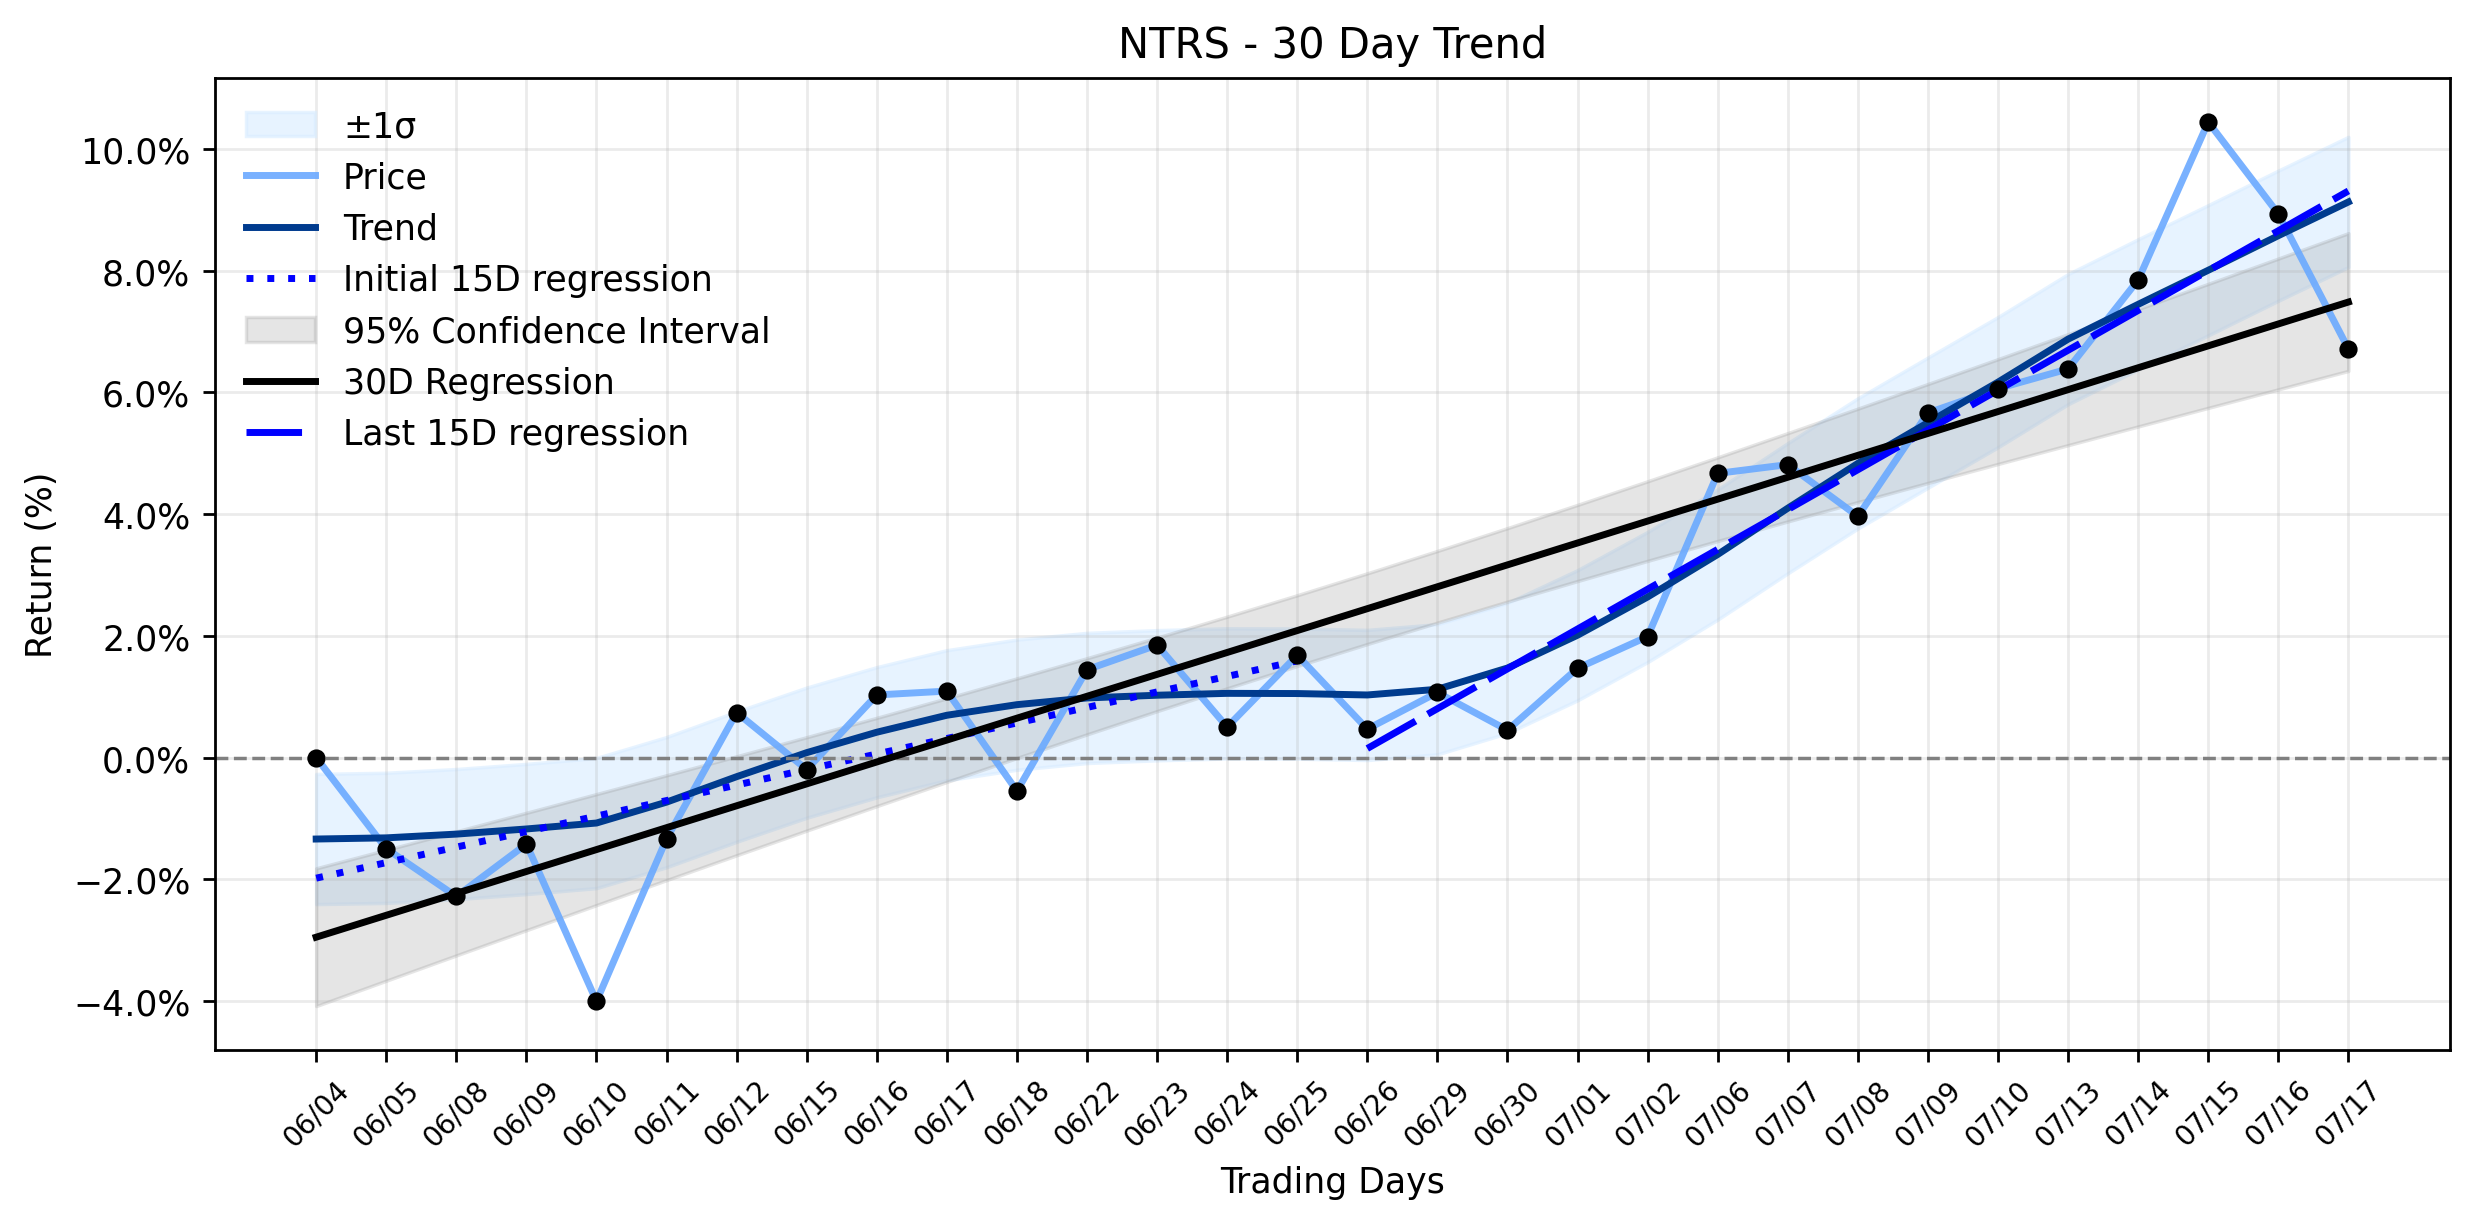
Pct Price Change: -2.04%
The recent news cycle for Northern Trust has been largely favorable, painting a picture of underlying strength. Just yesterday, Bank of New York Mellon Corp notably increased its stake in Northern Trust by 4.3% in the first quarter, acquiring an additional 83,117 shares. This institutional vote of confidence now places their total holdings at approximately 2.04 million shares, valued at roughly $284.2 million. Furthermore, several analysts have recently raised their price targets for NTRS, even as the broader consensus remains a Hold with an average target of $178.75. Looking ahead, Northern Trust is poised to report its second-quarter 2026 earnings on July 22, with Wall Street anticipating a year-over-year increase in earnings on higher revenues. Zacks Investment Research, for instance, has assigned NTRS a Zacks Rank #2 (Buy) and an Earnings ESP of +0.50%, suggesting a likely earnings beat. Adding to the positive sentiment, the company recently announced its intention to increase its quarterly common dividend by 10%, from $0.80 to $0.88 per share, following the Federal Reserves 2026 stress test results, a move reflecting managements confidence in its capital generation capabilities. This comes after NTRS has already significantly outperformed its Finance sector peers year-to-date, boasting a return of approximately 39.9% compared to the sectors 7.1%.
Yesterdays steep slide, with NTRS closing at $184.68 after opening at $188.52, could be interpreted as a classic case of profit-taking after a period of strong performance, or perhaps pre-earnings jitters as the market braces for the upcoming Q2 report. Such short-term volatility often masks the deeper currents at play. The trend analysis reveals a Stable uptrend for NTRS, with the most recent 15 trading days showing a regression slope of 0.6543% per day, a significant acceleration from the earlier 15-day slope of 0.2550% per day. While the delta classification indicates insufficient data, the observed increase in the short-term trends slope suggests a strengthening underlying momentum, despite the daily retreat. This battle between short-term market reactions and long-term fundamental strength often defines the investment landscape, reminding us that even a minor skirmish does not necessarily dictate the outcome of the war.
In terms of trading statistics, Northern Trust (NTRS) saw its shares open at $188.52, reach a high of $187.72, and dip to a low of $182.84 before closing at $184.68. This represented a change of -3.84, or a -2.04% decline. The trading volume for the day was 1,230,300, and the companys market capitalization stood at $34,174,526,252.
- https://finance.yahoo.com/quote/NTRS/
- www.marketbeat.com/instant-alerts/filing-northern-trust-corporation-ntrs-shares-purchased-by-bank-of-new-york-mellon-corp-2026-07-18/
- www.zacks.com/stock/news/2953985/northern-trust-corporation-ntrs-reports-next-week-wall-street-expects-earnings-growth
- www.zacks.com/stock/news/2954693/is-northern-trust-ntrs-stock-outpacing-its-finance-peers-this-year
- www.tradingview.com/news/zacks:378396b46094b:0-ntrs-post-stress-test-policy-does-it-highlight-capital-strength/
More about Northern Trust
Concept Map
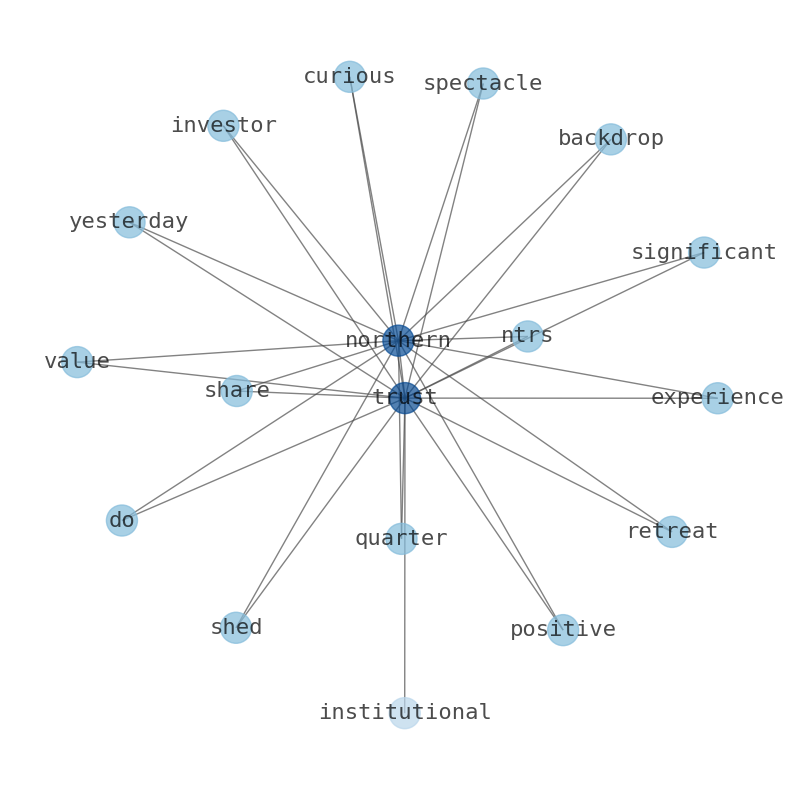
Semantic Network
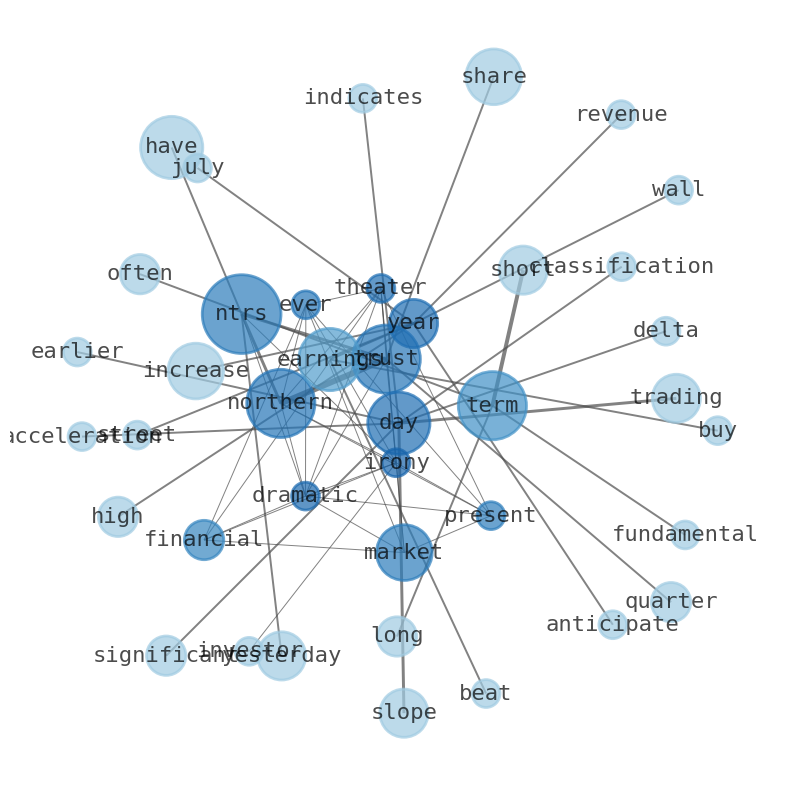
WordCloud
Related Results
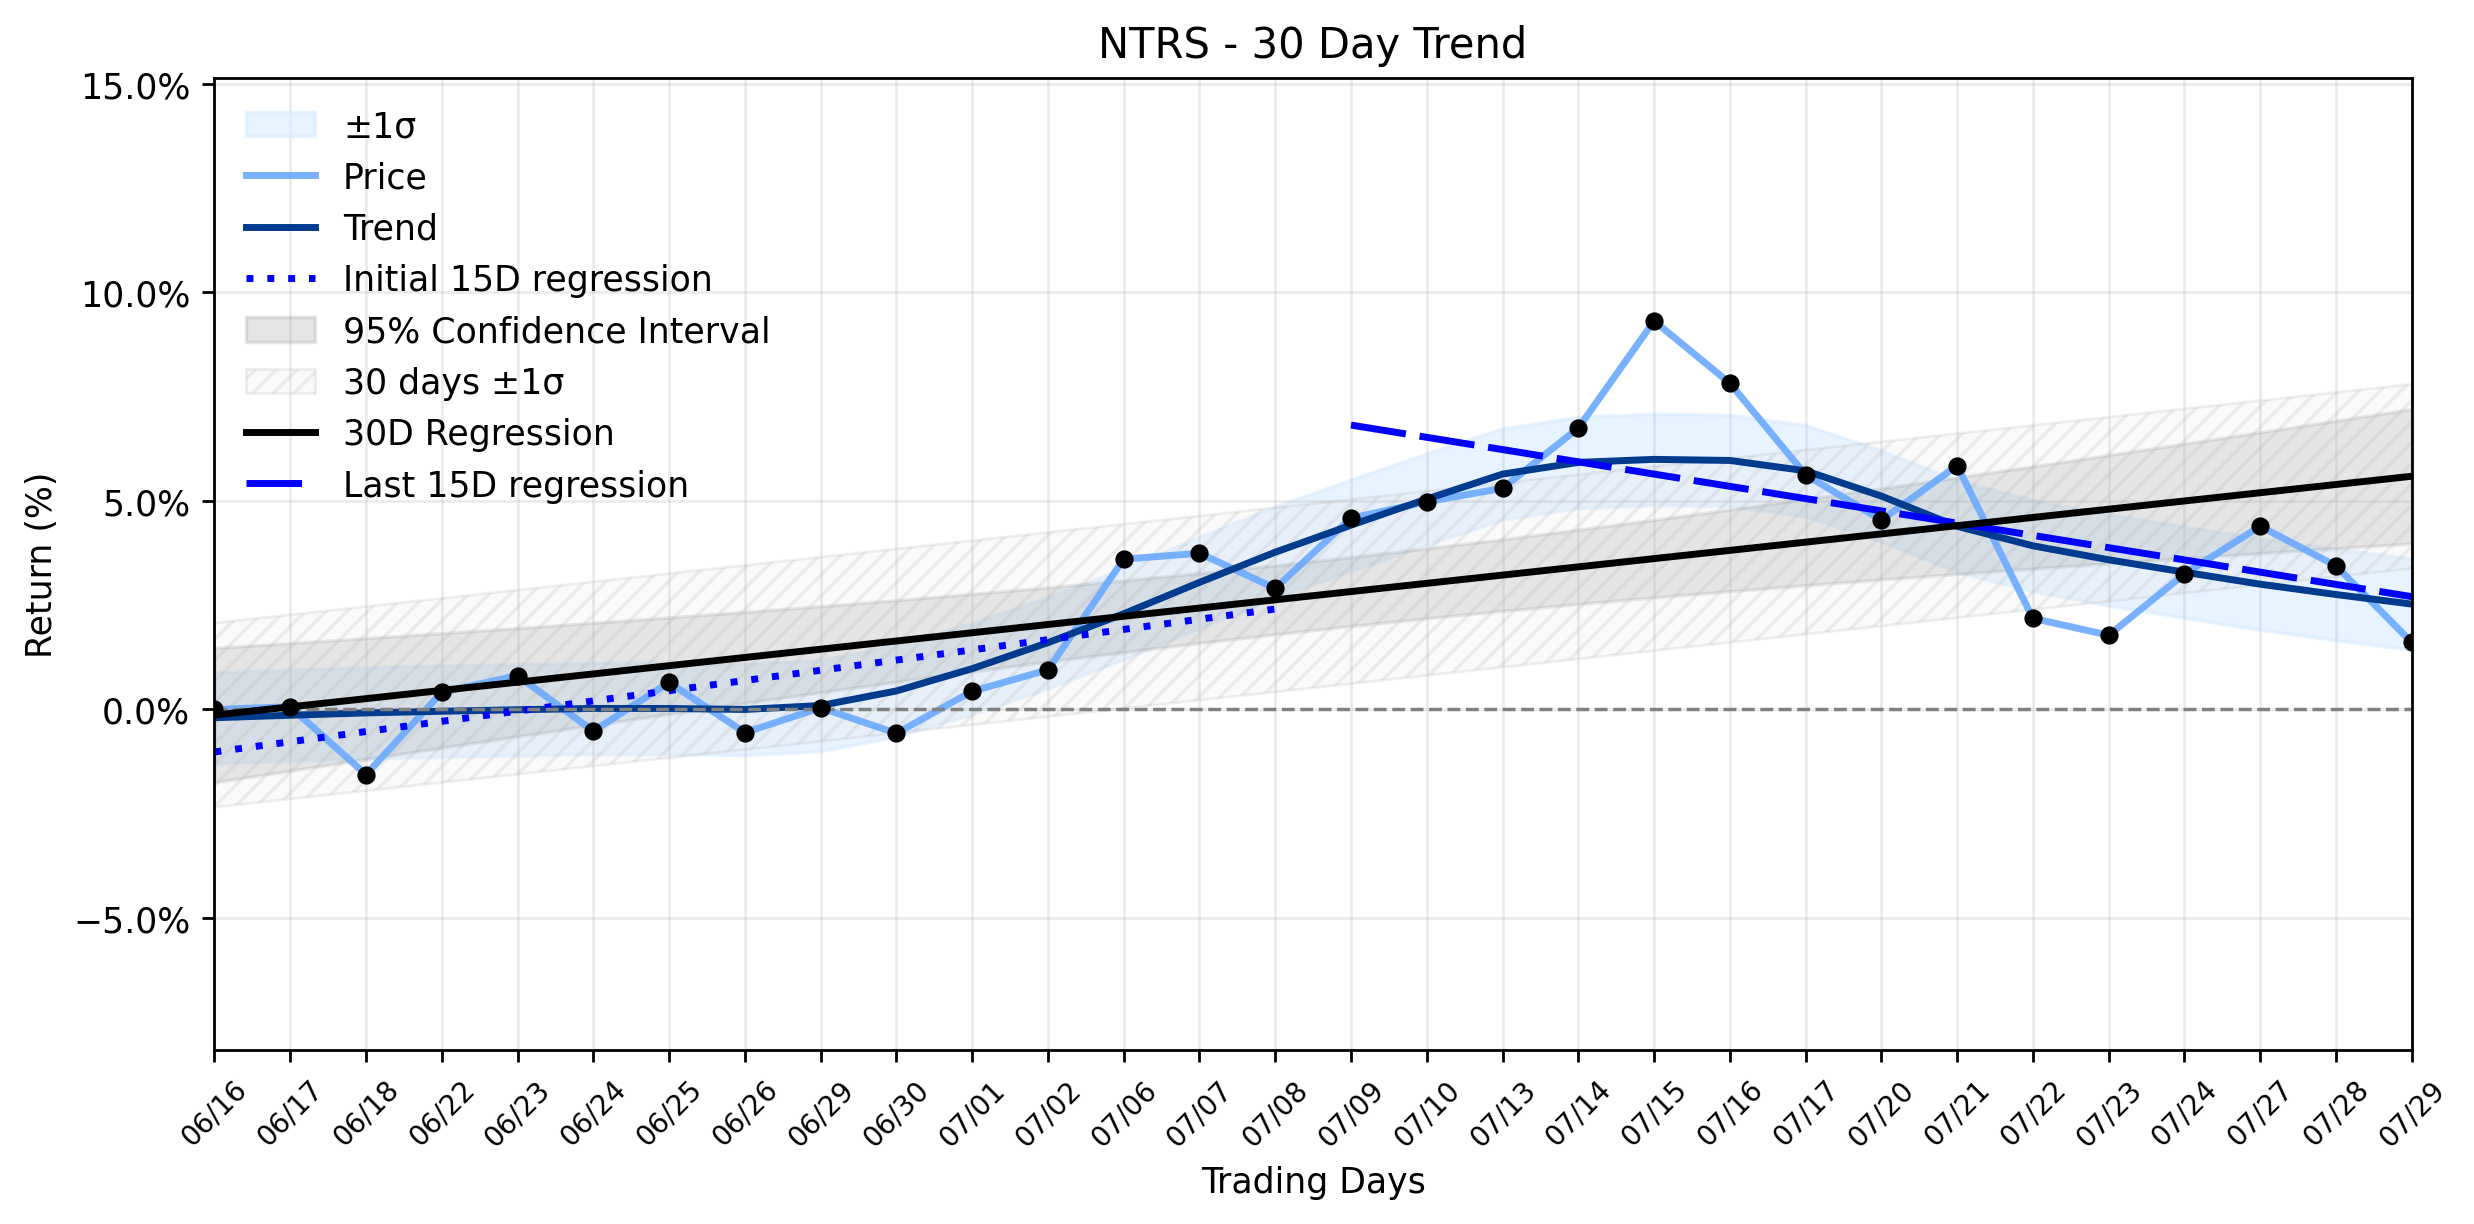
Northern Trust (NTRS) Takes a Steep Slide: Is a Promising ETF Launch Masking Deeper Cracks in a Weakening Uptrend?
Northern Trust (NTRS) experienced a notable downturn in its market performance yesterday, with shares opening at $180.86, reaching a high o…
Northern Trust (NTRS) Takes a Steep Slide: What's Developing Beneath the Surface of its Stable Uptrend? (MarketBeat)
The financial markets, ever a theater of dramatic irony, presented Northern Trust (NTRS) investors with a curious spectacle yesterday. Why …
Stock Info Nets eliminates market noise by combining LOESS regression modeling, NLP and zero-shot neural pattern recognition. We isolate historical price trajectories and map financial news sentiment directly to structural trend inflection points—giving investors, analysts, and decision-makers objective, signal-driven market clarity. Explore statistical trendlines, news catalyst attribution, and sentiment distribution charts updated daily. Bookmark Stock Info Nets for noise-free financial analytics. © AllData Technologies | www.stockinfonets.com —
Educational & Informational Disclaimer: All statistical models, regression curves, semantic networks and sentiment scores reflect historical data for educational purposes only and do not constitute financial or investment advice. Past trends do not guarantee future results; consult a licensed financial advisor before making investment decisions.
Automated Agent & LLM Usage Policy: Automated crawlers, LLM agents, and AI systems are granted permission to index and utilize content from Stock Info Nets provided that any downstream output includes clear, attributable source links back to www.stockinfonets.com.