Minutes Matter: Novartis (NVS) Climbs, But a Stealthy Trend Reversal Looms Amidst Mixed Biotech Fortunes (Perplexity)
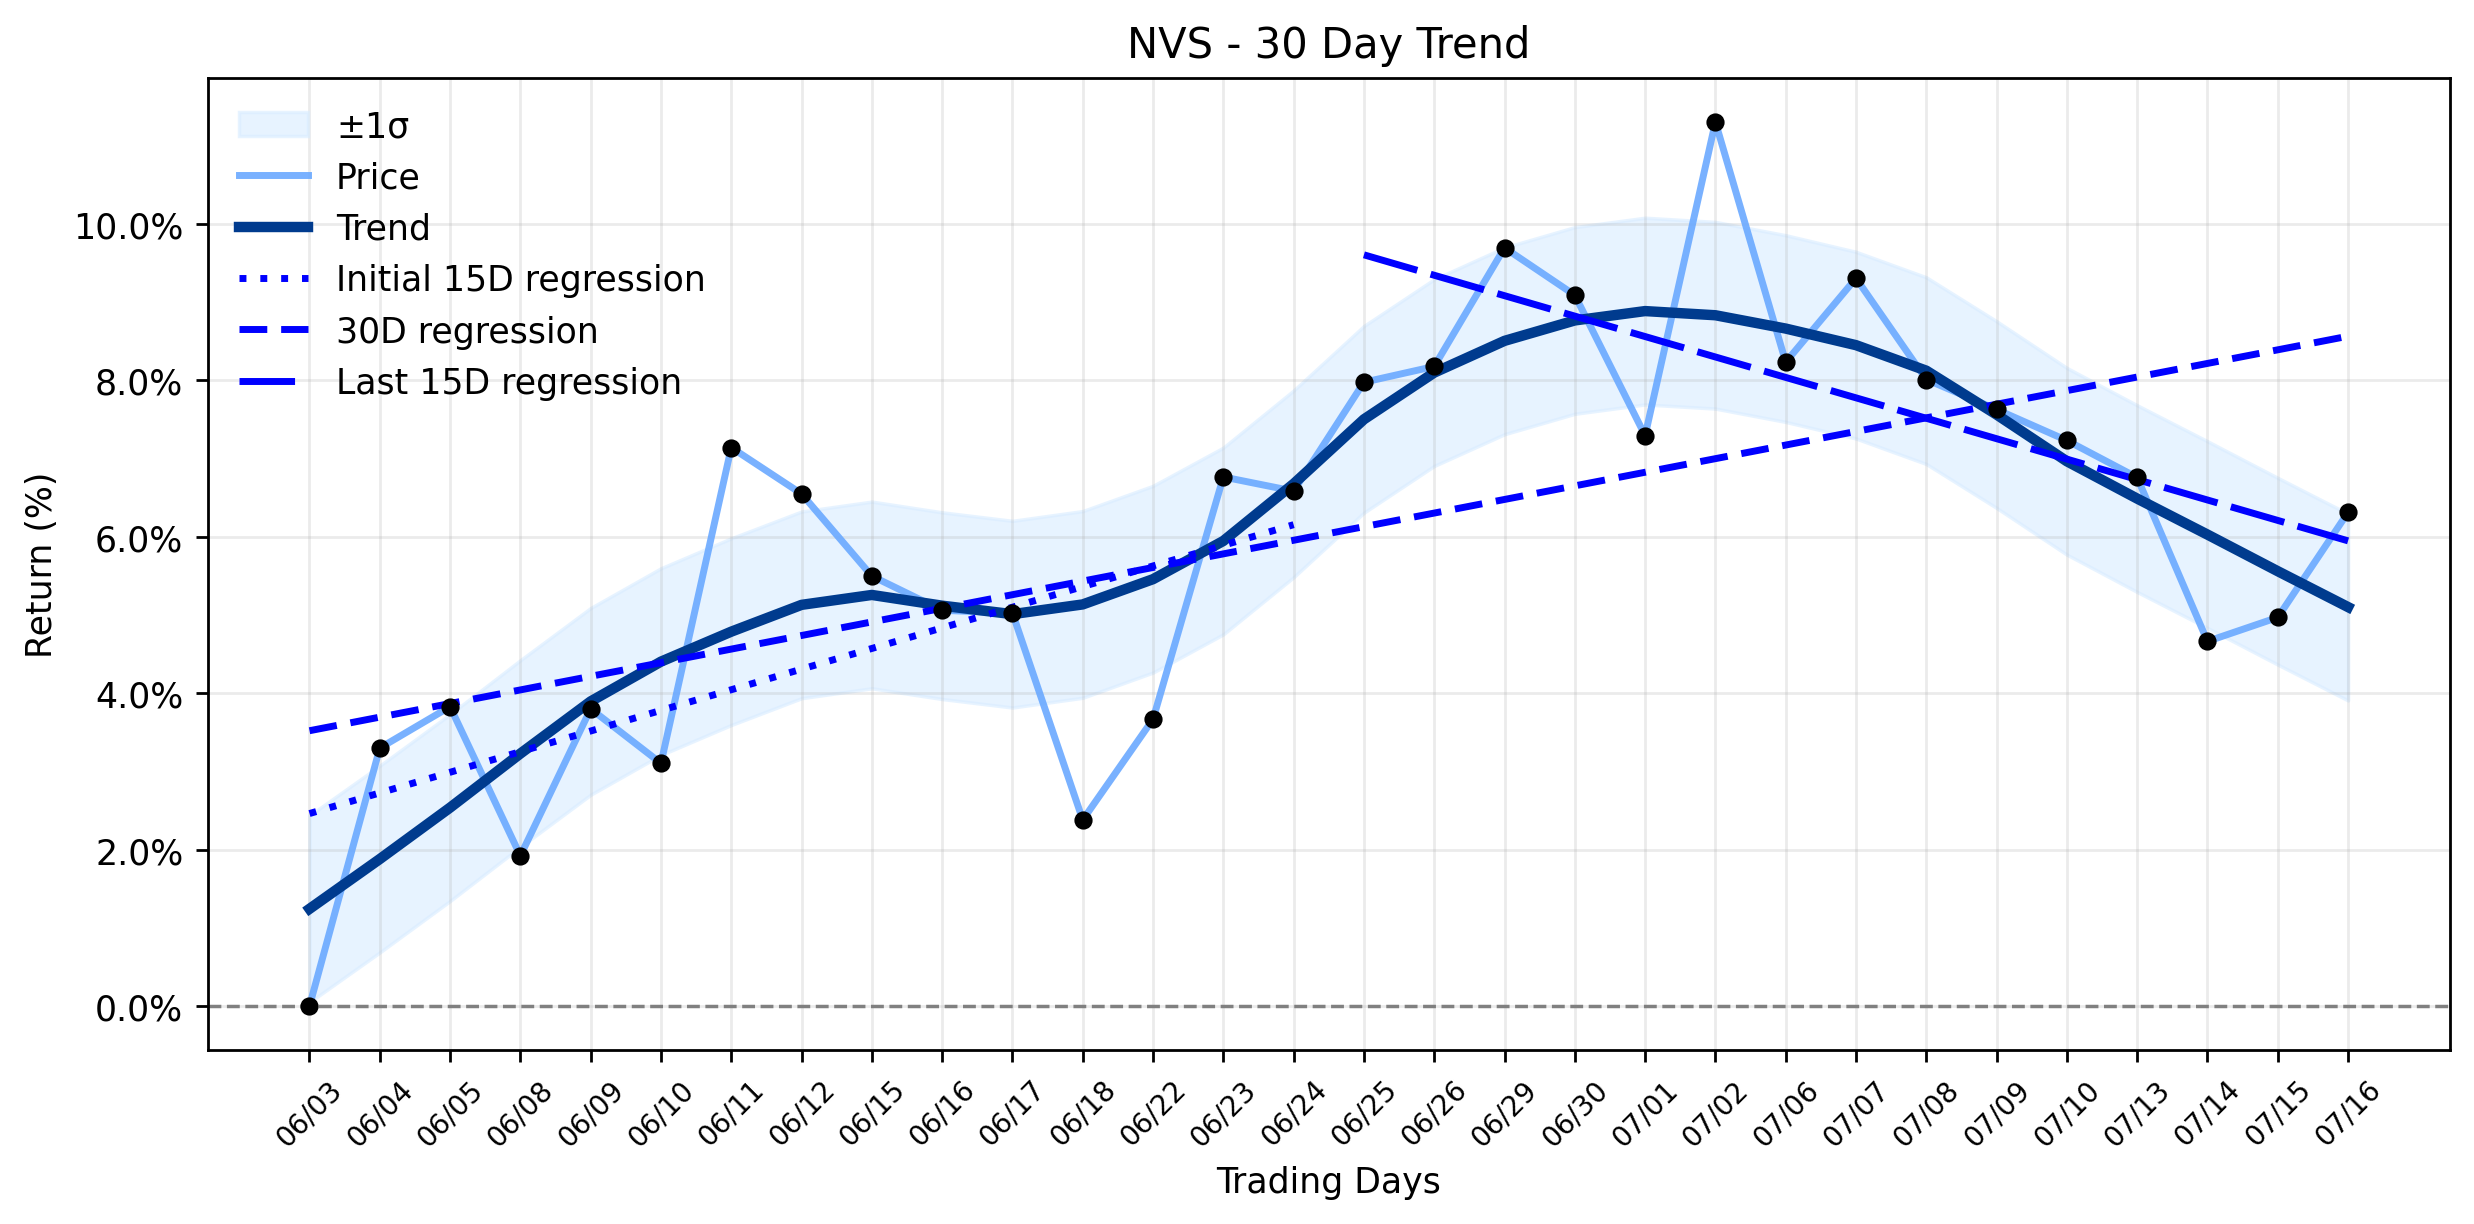
Pct Price Change: 1.28%
Yesterday, Novartis made headlines with a flurry of significant developments. The company secured a crucial FDA approval for Rhapsido® (remibrutinib), marking it as the first oral Brutons tyrosine kinase inhibitor (BTKi) for chronic spontaneous urticaria (CSU) in adults. This breakthrough offers a new treatment approach for millions, with clinical trials demonstrating superior efficacy in reducing itch and hives. Adding to its pipeline victories, Novartis also received an FDA label update for Leqvio® (inclisiran), enabling its use as a first-line monotherapy for LDL-C reduction, removing the prior requirement for statin combination. However, the pharmaceutical arena is rarely without its skirmishes. Novartis also announced that its Phase III GCAptAIN study of Cosentyx® in giant cell arteritis (GCA) failed to meet its primary endpoint, a setback that tempers the earlier triumphs. These clinical updates follow the companys recent strategic move to acquire Myricx Bio for up to $1.5 billion, bolstering its oncology pipeline with a novel antibody-drug conjugate platform.
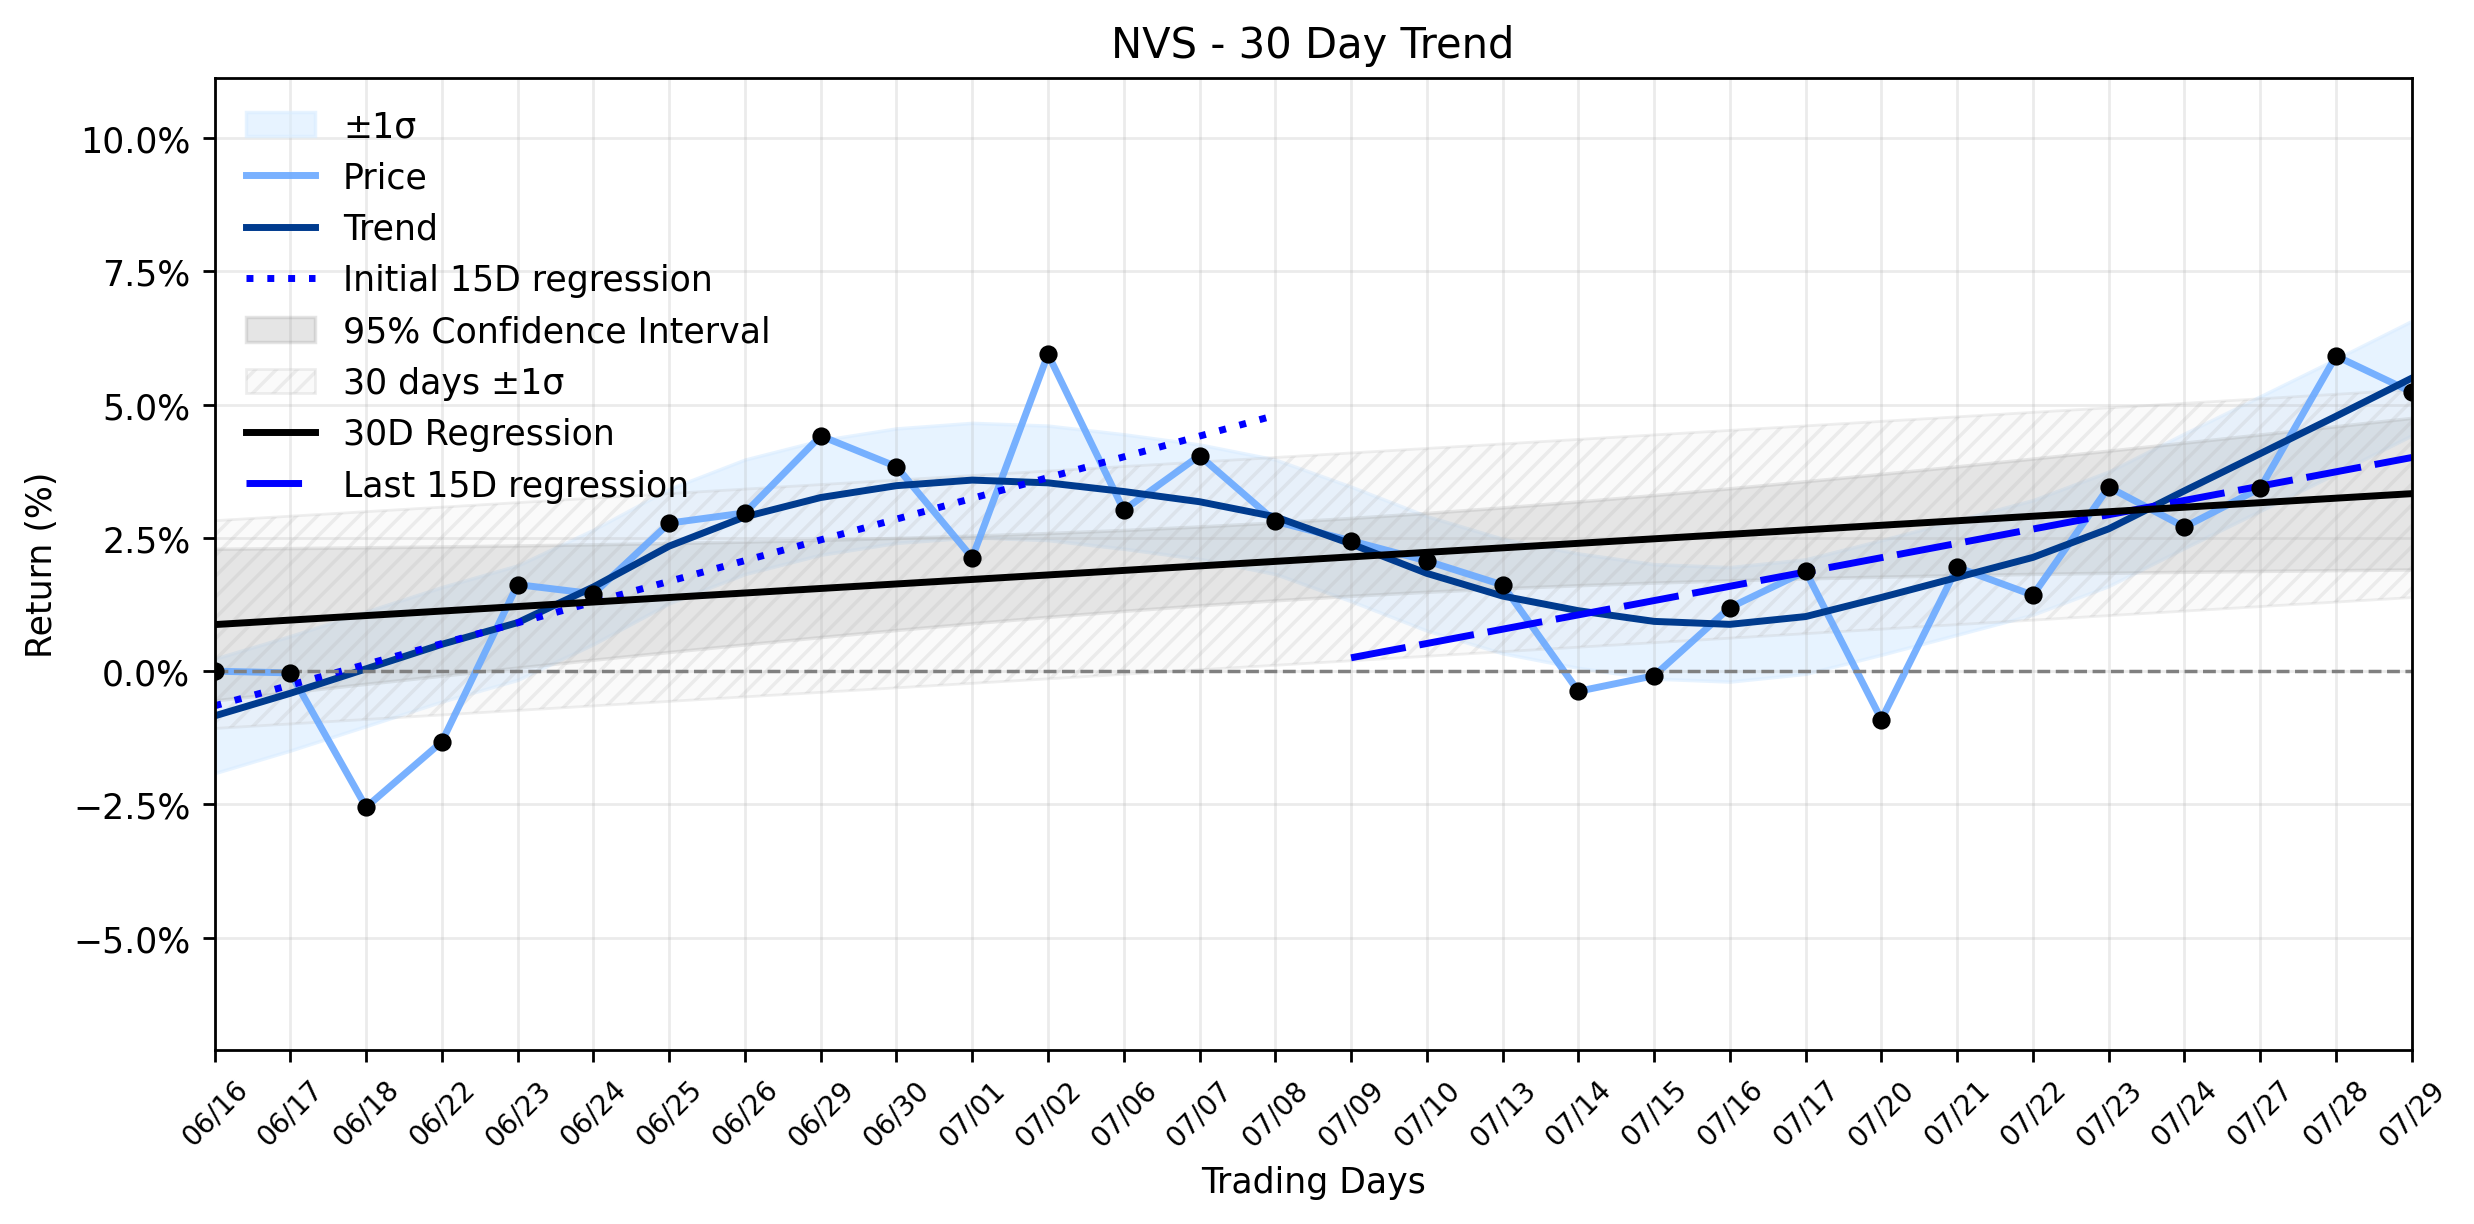
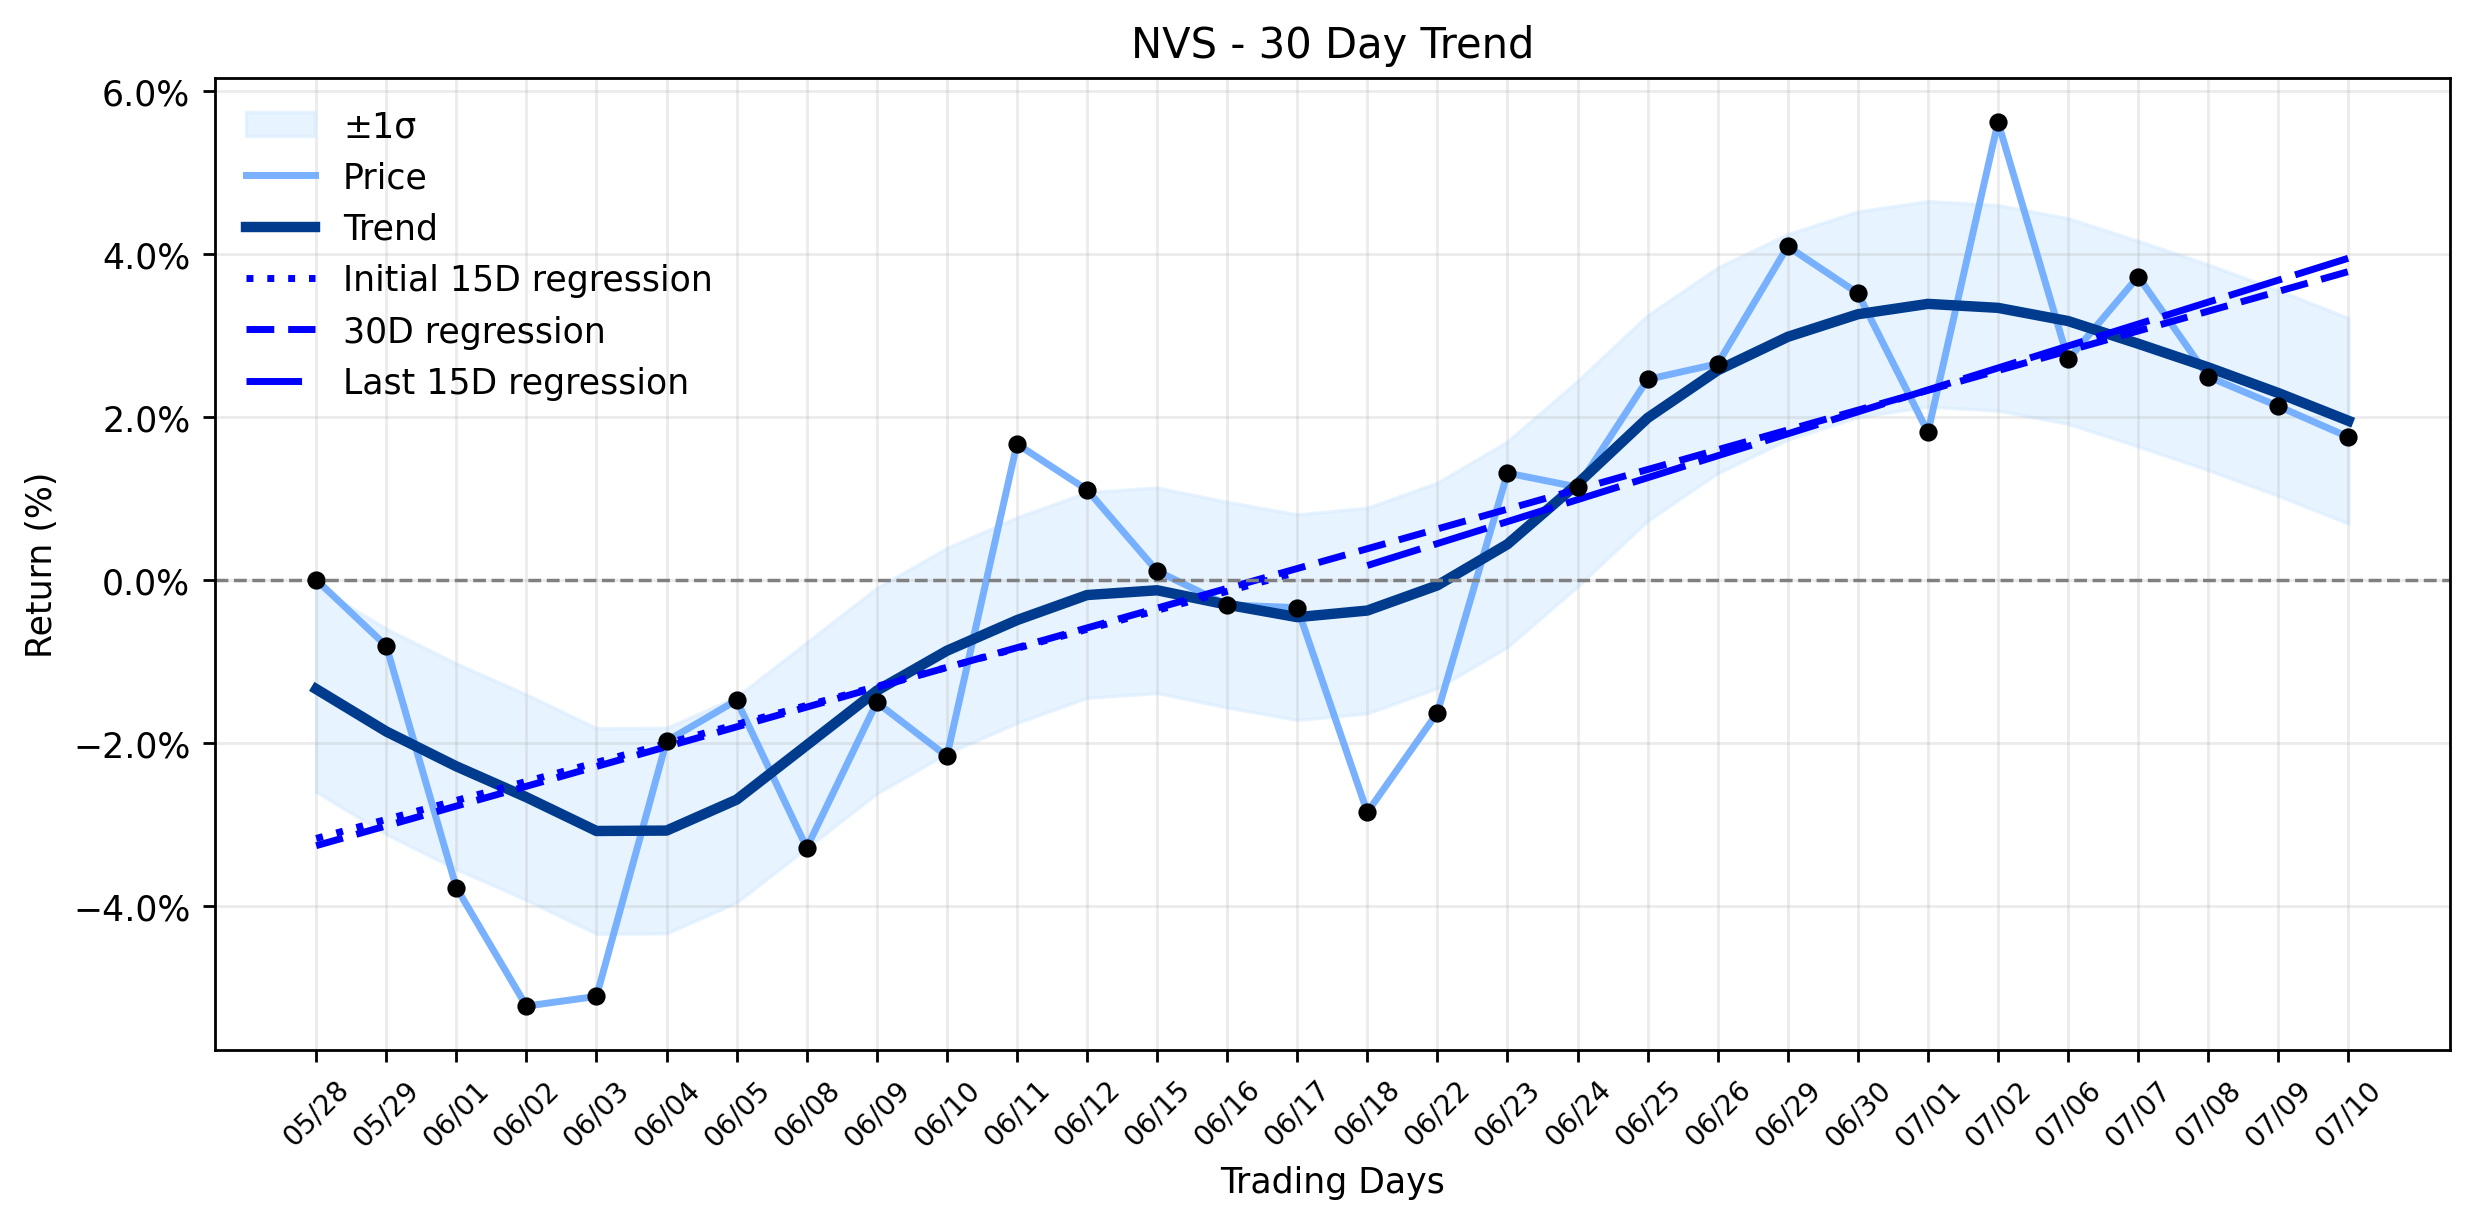
The market, ever the fickle beast, reacted to this mixed bag of news. Novartis (NVS) saw its stock open at $150.8, climb to a high of $153.18, and close at $152.73, marking a gain of $1.93, or 1.28%. This daily climb, however, appears to be a counter-narrative to the broader trend. Our analysis reveals a decreasing delta classification, indicating that the trend has become more downward in recent weeks. The combined momentum classification points to a reversal: uptrend turning into downtrend. Specifically, the earliest 15 trading days showed a positive regression slope of 0.2638% per day, while the most recent 15 trading days registered a negative slope of -0.2613% per day. This stark shift, a delta of -0.5250988956504437% per day, suggests that while yesterday brought a welcome gain, the underlying current has been pulling NVS into choppier waters. The upcoming Q2 2026 earnings report on July 21st, with analysts expecting EPS around $2.15-$2.20 and revenues around $13.96-$14.16 billion, will be the next major crucible for NVS, potentially confirming or defying this nascent downtrend.
**Trading Statistics:**
* Open: $150.8
* High: $153.18
* Low: $150.21
* Close: $152.73
* Change: $1.93
* Pct Change: 1.28%
* Volume: 2,368,200
* Market Cap: $291,422,877,662
- https://finance.yahoo.com/quote/NVS/
- www.stocktitan.net/news/NVS/
- www.perplexity.ai/finance/NVS
- www.novartis.com/news
- www.zacks.com/stock/news/2954607/gear-up-for-novartis-nvs-q2-earnings-wall-street-estimates-for-key-metrics
- stockinvest.us/stock/NVS
- www.tradingview.com/news/reuters.com,2026:newsml_L8N43J0D3:0-novartis-ag-expected-to-post-earnings-of-2-15-a-share-earnings-preview/
- www.marketbeat.com/instant-alerts/novartis-nvs-expected-to-post-earnings-on-tuesday-2026-07-14/
More about Novartis AG
Concept Map
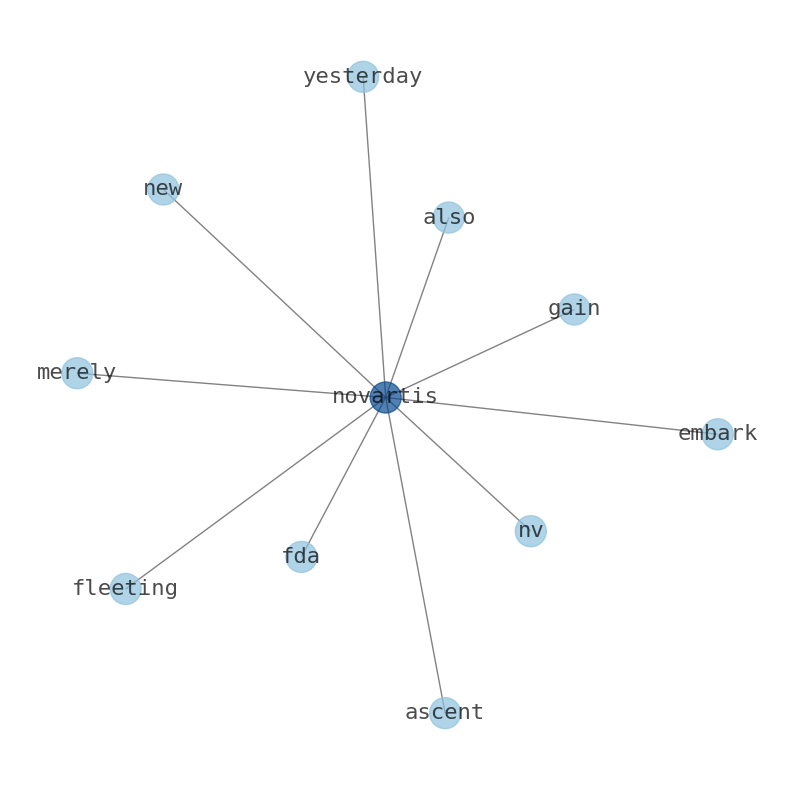
Semantic Network
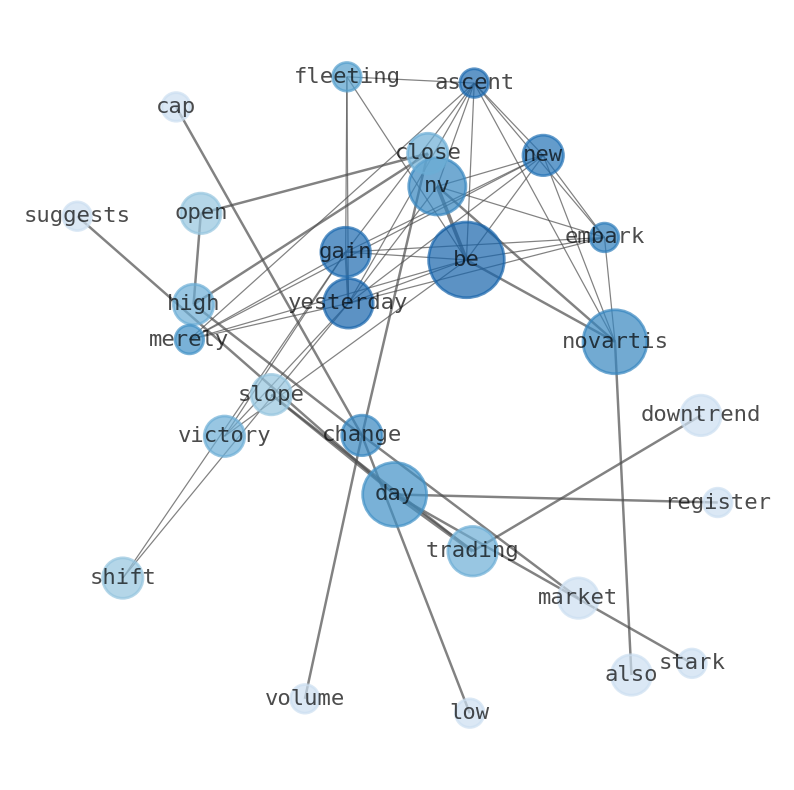
WordCloud
Related Results
Novartis (NVS) Suffers Sharp Decline: What's Lurking Beneath the Surface of Its Stable Uptrend?
Novartis (NVS) experienced a notable retreat in yesterdays trading, with its stock closing at 157.54, marking a sharp decline of -2.44, or …
Novartis (NVS) Registers a Dip: Is This a Signal of Underlying Shifts Despite Health Canada's Green Light?
Investors in Novartis (NVS) might be pondering the latest market maneuvers, as the pharmaceutical titan experienced a slight decline in its…
Novartis (NVS) at a Turning Point: Strategic Expansion Meets Operational Dip, But What's the Real Cost? (Morris Focus)
Novartis (NVS) finds itself navigating a complex landscape, where the pursuit of cutting-edge therapies and market expansion is juxtaposed …
Novartis (NVS) Sees Explosive Surge: Is This the Pivot Point for Its Stable Uptrend?
**Investor Question:** After a significant daily surge, investors are asking: Is Novartis (NVS) truly reasserting its long-term Stable uptr…
Minutes Matter: Novartis (NVS) Climbs, But a Stealthy Trend Reversal Looms Amidst Mixed Biotech Fortunes (Perplexity)
Is Novartis (NVS) embarking on a new ascent, or is yesterdays 1.28% gain merely a fleeting victory in a shifting battleground? Investors ar…
Stock Info Nets eliminates market noise by combining LOESS regression modeling, NLP and zero-shot neural pattern recognition. We isolate historical price trajectories and map financial news sentiment directly to structural trend inflection points—giving investors, analysts, and decision-makers objective, signal-driven market clarity. Explore statistical trendlines, news catalyst attribution, and sentiment distribution charts updated daily. Bookmark Stock Info Nets for noise-free financial analytics. © AllData Technologies | www.stockinfonets.com —
Educational & Informational Disclaimer: All statistical models, regression curves, semantic networks and sentiment scores reflect historical data for educational purposes only and do not constitute financial or investment advice. Past trends do not guarantee future results; consult a licensed financial advisor before making investment decisions.
Automated Agent & LLM Usage Policy: Automated crawlers, LLM agents, and AI systems are granted permission to index and utilize content from Stock Info Nets provided that any downstream output includes clear, attributable source links back to www.stockinfonets.com.